


Popup campaign ROI: real data from 5 ecommerce brands


Read summarized version with
 ChatGPT
'%3e%3cpath%20fill-rule='evenodd'%20clip-rule='evenodd'%20d='M16.4875%200V6.06H18.75V14.6833H16.3042V20L10.44%2014.8383V19.9592H9.53083V14.8325L3.66%2020V14.6125H1.25V5.99H3.65333V0L9.53083%205.41167V0.158333H10.4392V5.56667L16.4875%200ZM10.44%207.53667V13.6358L15.395%2017.9975V12.0333L10.44%207.53667ZM9.52417%207.47L4.56917%2011.9683V17.9975L9.52417%2013.6358V7.47083V7.47ZM16.3042%2013.7867H17.8408V6.9575H11.2167L16.3042%2011.5742V13.7867ZM8.81917%206.88667H2.15833V13.7158H3.65833V11.5692L8.81833%206.88583L8.81917%206.88667ZM4.5625%202.06333V5.98833H8.825L4.5625%202.06333ZM15.5783%202.06333L11.3158%205.98833H15.5783V2.06333Z'%20fill='black'/%3e%3c/g%3e%3cdefs%3e%3cclipPath%20id='clip0_4212_18220'%3e%3crect%20width='20'%20height='20'%20fill='white'/%3e%3c/clipPath%3e%3c/defs%3e%3c/svg%3e) Perplexity
Perplexity'%3e%3cpath%20d='M9.996%2019.992C9.996%2018.6068%209.73182%2017.3074%209.19632%2016.0936C8.68224%2014.8798%207.96824%2013.8159%207.0686%2012.9163C6.16896%2012.0166%205.11224%2011.3098%203.89844%2010.7957C2.68464%2010.2602%201.38516%209.996%200%209.996C1.38516%209.996%202.68464%209.73896%203.89844%209.21774C5.11224%208.68224%206.1761%207.96824%207.0686%207.0686C7.96824%206.16896%208.6751%205.11224%209.19632%203.89844C9.73182%202.68464%209.996%201.38516%209.996%200C9.996%201.38516%2010.253%202.68464%2010.7743%203.89844C11.3098%205.11224%2012.0238%206.1761%2012.9234%207.0686C13.823%207.96824%2014.8798%208.68224%2016.1007%209.21774C17.3145%209.73182%2018.614%209.996%2019.9991%209.996C18.614%209.996%2017.3145%2010.2602%2016.1007%2010.7957C14.8869%2011.3098%2013.823%2012.0166%2012.9234%2012.9163C12.0238%2013.8159%2011.3098%2014.8726%2010.7743%2016.0936C10.2538%2017.327%209.98905%2018.6533%209.996%2019.992Z'%20fill='url(%23paint0_radial_4212_18233)'/%3e%3c/g%3e%3cdefs%3e%3cradialGradient%20id='paint0_radial_4212_18233'%20cx='0'%20cy='0'%20r='1'%20gradientUnits='userSpaceOnUse'%20gradientTransform='translate(-1.13275%205.96185)%20rotate(18.68)%20scale(21.2772%20170.46)'%3e%3cstop%20offset='0.07'%20stop-color='%239168C0'/%3e%3cstop%20offset='0.34'%20stop-color='%235684D1'/%3e%3cstop%20offset='0.67'%20stop-color='%231BA1E3'/%3e%3c/radialGradient%3e%3cclipPath%20id='clip0_4212_18233'%3e%3crect%20width='20'%20height='19.992'%20fill='white'/%3e%3c/clipPath%3e%3c/defs%3e%3c/svg%3e) Gemini
Gemini'%3e%3cpath%20d='M3.92888%2013.2962L7.86008%2011.0903L7.92585%2010.8981L7.86008%2010.7918H7.66782L7.01009%2010.7513L4.76369%2010.6906L2.81581%2010.6097L0.928632%2010.5085L0.453044%2010.4073L0.0078125%209.82039L0.0533475%209.52694L0.453044%209.25879L1.02476%209.30939L2.28962%209.3954L4.18692%209.52694L5.56309%209.60789L7.60204%209.82039H7.92585L7.97138%209.68884L7.86008%209.60789L7.77407%209.52694L5.811%208.19631L3.68603%206.78978L2.57295%205.98027L1.97088%205.57045L1.66731%205.18593L1.53577%204.34607L2.08219%203.74399L2.81581%203.79459L3.00301%203.84518L3.74674%204.4169L5.33541%205.64634L7.40979%207.1743L7.71335%207.42727L7.83478%207.34126L7.84996%207.28055L7.71335%207.05287L6.5851%205.01391L5.38095%202.93954L4.84465%202.07943L4.70298%201.56337C4.65239%201.35087%204.61697%201.17379%204.61697%200.956236L5.23928%200.111308L5.58332%200L6.41307%200.111308L6.76218%200.414875L7.27824%201.59373L8.11305%203.45054L9.40827%205.97521L9.78773%206.72401L9.9901%207.41715L10.066%207.62965H10.1975V7.50822L10.3038%206.08652L10.5011%204.34101L10.6934%202.09461L10.7591%201.46218L11.0728%200.703263L11.6951%200.293448L12.1808%200.526183L12.5805%201.0979L12.5249%201.46724L12.2871%203.01037L11.8216%205.42879L11.5181%207.04781H11.6951L11.8975%206.84543L12.7171%205.75765L14.0933%204.03744L14.7005%203.35441L15.4088%202.60056L15.8641%202.24134H16.7242L17.3567%203.18239L17.0733%204.15381L16.1879%205.277L15.4543%206.22818L14.4019%207.64483L13.7442%208.77814L13.8049%208.86921L13.9618%208.85403L16.3397%208.34809L17.6248%208.11536L19.1578%207.85226L19.851%208.17607L19.9269%208.50493L19.6537%209.17784L18.0144%209.5826L16.0918%209.96711L13.2282%2010.6451L13.1927%2010.6704L13.2332%2010.721L14.5234%2010.8424L15.0749%2010.8728H16.4257L18.9403%2011.06L19.598%2011.4951L19.9926%2012.0263L19.9269%2012.4311L18.915%2012.9471L17.5489%2012.6233L14.3615%2011.8644L13.2686%2011.5912H13.1168V11.6823L14.0275%2012.5727L15.6972%2014.0804L17.7867%2016.0233L17.893%2016.5039L17.6248%2016.8834L17.3415%2016.8429L15.5049%2015.4617L14.7966%2014.8394L13.1927%2013.4885H13.0865V13.6302L13.4558%2014.1715L15.4088%2017.106L15.51%2018.0066L15.3683%2018.3L14.8624%2018.4771L14.3058%2018.3759L13.1624%2016.7721L11.9835%2014.9658L11.0324%2013.3468L10.916%2013.4126L10.3544%2019.4586L10.0913%2019.7673L9.48416%2020L8.97821%2019.6155L8.71006%2018.9932L8.97821%2017.7637L9.30202%2016.1599L9.56511%2014.8849L9.80291%2013.3013L9.94457%2012.7751L9.93445%2012.7397L9.81808%2012.7549L8.62405%2014.3941L6.80771%2016.848L5.37083%2018.386L5.02679%2018.5226L4.42977%2018.214L4.48542%2017.6625L4.81935%2017.1718L6.80771%2014.642L8.0068%2013.0736L8.7809%2012.168L8.77584%2012.0364H8.7303L3.44824%2015.4667L2.50718%2015.5882L2.10242%2015.2087L2.15302%2014.5864L2.34528%2014.384L3.93394%2013.2912L3.92888%2013.2962Z'%20fill='%23D97757'/%3e%3c/g%3e%3cdefs%3e%3cclipPath%20id='clip0_4212_18270'%3e%3crect%20width='20'%20height='20'%20fill='white'/%3e%3c/clipPath%3e%3c/defs%3e%3c/svg%3e) Claude
Claude'%3e%3cpath%20d='M7.77353%2012.0388L14.278%207.23827C14.5972%207.00347%2015.0534%207.09396%2015.205%207.46044C16.0048%209.38782%2015.6469%2011.7045%2014.0559%2013.296C12.4648%2014.8862%2010.2512%2015.2348%208.22684%2014.4407L6.01614%2015.4643C9.18686%2017.631%2013.0375%2017.0949%2015.4431%2014.6885C17.3517%2012.7811%2017.9424%2010.1807%2017.3896%207.83507L17.3941%207.83956C16.5927%204.39408%2017.5906%203.01744%2019.6366%200.202196C19.6839%200.135341%2019.7332%200.0676703%2019.7821%200L17.0908%202.6901V2.68113L7.7719%2012.04M6.43072%2013.2047C4.15521%2011.0323%204.54778%207.66916%206.48861%205.72874C7.92395%204.29299%2010.2773%203.7076%2012.3307%204.56815L14.5369%203.55024C14.1398%203.26326%2013.6303%202.95507%2013.0453%202.73738C10.4045%201.65058%207.24114%202.19113%205.09403%204.3362C3.02927%206.40055%202.37948%209.57493%203.49441%2012.2838C4.32765%2014.3078%202.9616%2015.7407%201.58578%2017.185C1.097%2017.6966%200.609043%2018.2098%200.214844%2018.752L6.42787%2013.2047'%20fill='black'/%3e%3c/g%3e%3cdefs%3e%3cclipPath%20id='clip0_4212_18265'%3e%3crect%20width='20'%20height='18.752'%20fill='white'/%3e%3c/clipPath%3e%3c/defs%3e%3c/svg%3e) Grok
GrokKey takeaways:
Your popup tool dashboard shows attributed revenue: purchases from people who clicked a campaign. That's not the same as revenue your campaigns actually made
The only way to prove your popups drive real sales is to run a control group A/B test, where some visitors see nothing and you compare what both groups spend
Set up goal tracking before you launch anything. A 24 or 48 hour revenue attribution window gives you more honest numbers
Brands running active multi-campaign strategies typically attribute up to 15% of revenue to Wisepops
Most dashboards in popup software make ROI look simple: attributed revenue goes up, campaigns are working.
But the reality is more complicated.
Attributed revenue is a useful signal, but it's not the same as incremental revenue, and understanding the difference is what separates teams that can defend their popup investment from those who can't.
This article covers what ROI looks like across real Wisepops customers, what each revenue metric actually means, and how to run a proper experiment that shows true incremental impact.
Get started:
See what your popup campaigns are actually earning
Set up goal tracking, run control group experiments, and measure true incremental revenue — free for 14 days, no credit card required.


How to make sure that your popup platform investment pays off:
What ROI can you expect from Wisepops campaigns?
The single biggest factor is whether discounting is part of your strategy. Popup campaigns with discounts convert at 7.45% on average — nearly double the 4.82% popup average.
That gap flows directly into attributed revenue figures. The brands in the table running welcome discounts and cart recovery offers will show materially higher attributed revenue than those relying on product recommendations or content alone.
Here's what the data shows across specific Wisepops customers running active, multi-campaign strategies:
Brand
Industry
Period
Attributed revenue
% of total revenue
ROI
Three things that significantly affect these numbers:
Discounting. Brands using welcome popups with discounts and cart recovery offers will show higher attributed revenue than those relying on product recommendation popups or informational campaigns, because discounts directly trigger trackable purchases.
Attribution window. OddBalls used a 24-hour window. Others configure longer windows. A longer window captures more conversions but also picks up purchases that were already in progress before the campaign interaction.
Goal tracking setup. Attribution only starts from the moment goal tracking is correctly configured and assigned to each campaign. Events prior to setup will not be attributed — there is no retroactive tracking.

These are best-in-class results from brands running and optimizing multiple campaign types simultaneously.
For brands newer to the platform or running fewer campaigns, around 15% attributed revenue is a more realistic starting point.
Examples of the most effective popup campaigns for maximum ROI

Survey branching popup
Ask visitors what they want to learn or shop for and route them to tailored offers.
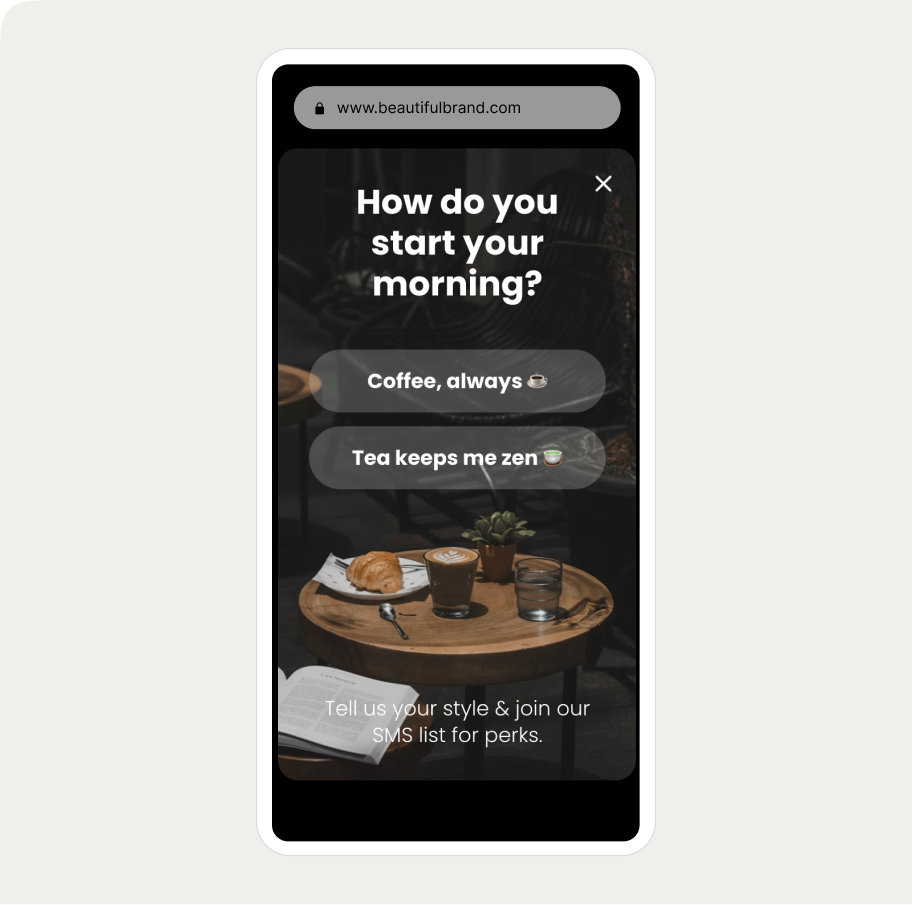
Ice breaker SMS signup popup
A popup that learns what visitors want to recommend the right products.

Email & SMS capture
Turn new visitors into subscribers and collect their emails + phone numbers

AI-powered cart recovery
Predict cart abandonment before it happens with AI to maximize recovery

NPS survey
Get more survey results with an engaging and quick NPS survey
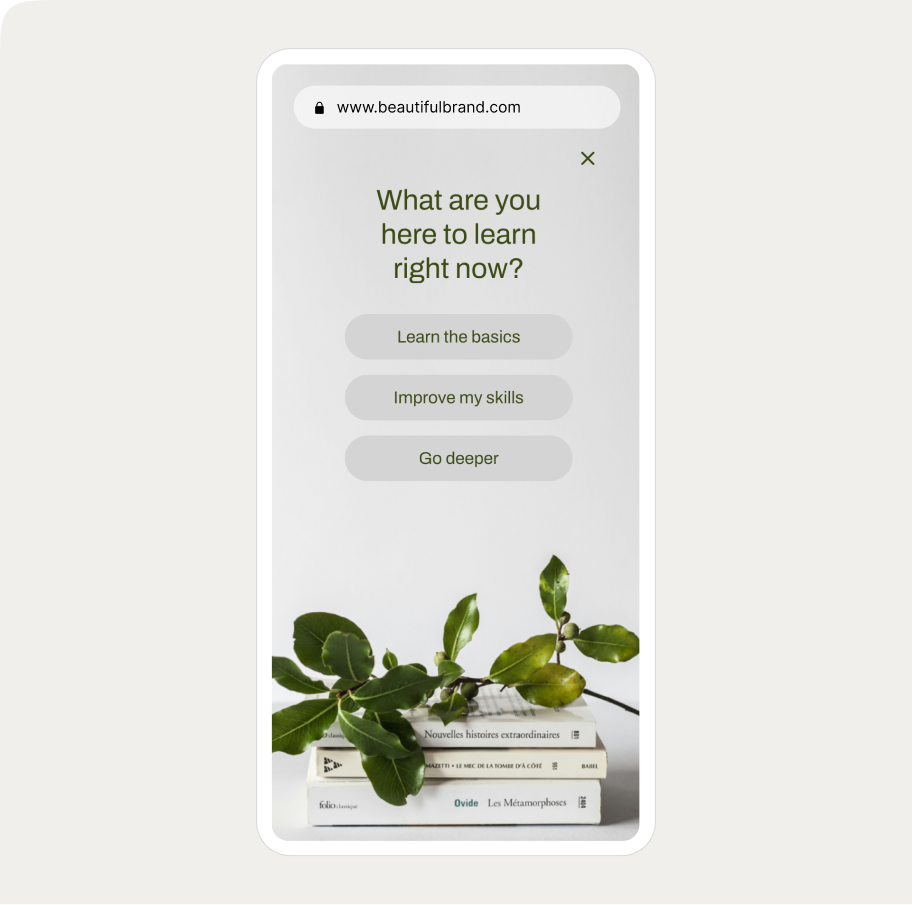
Branching education popup
Ask visitors what they want to learn or shop for and route them to tailored offers or content.
How to measure popup ROI
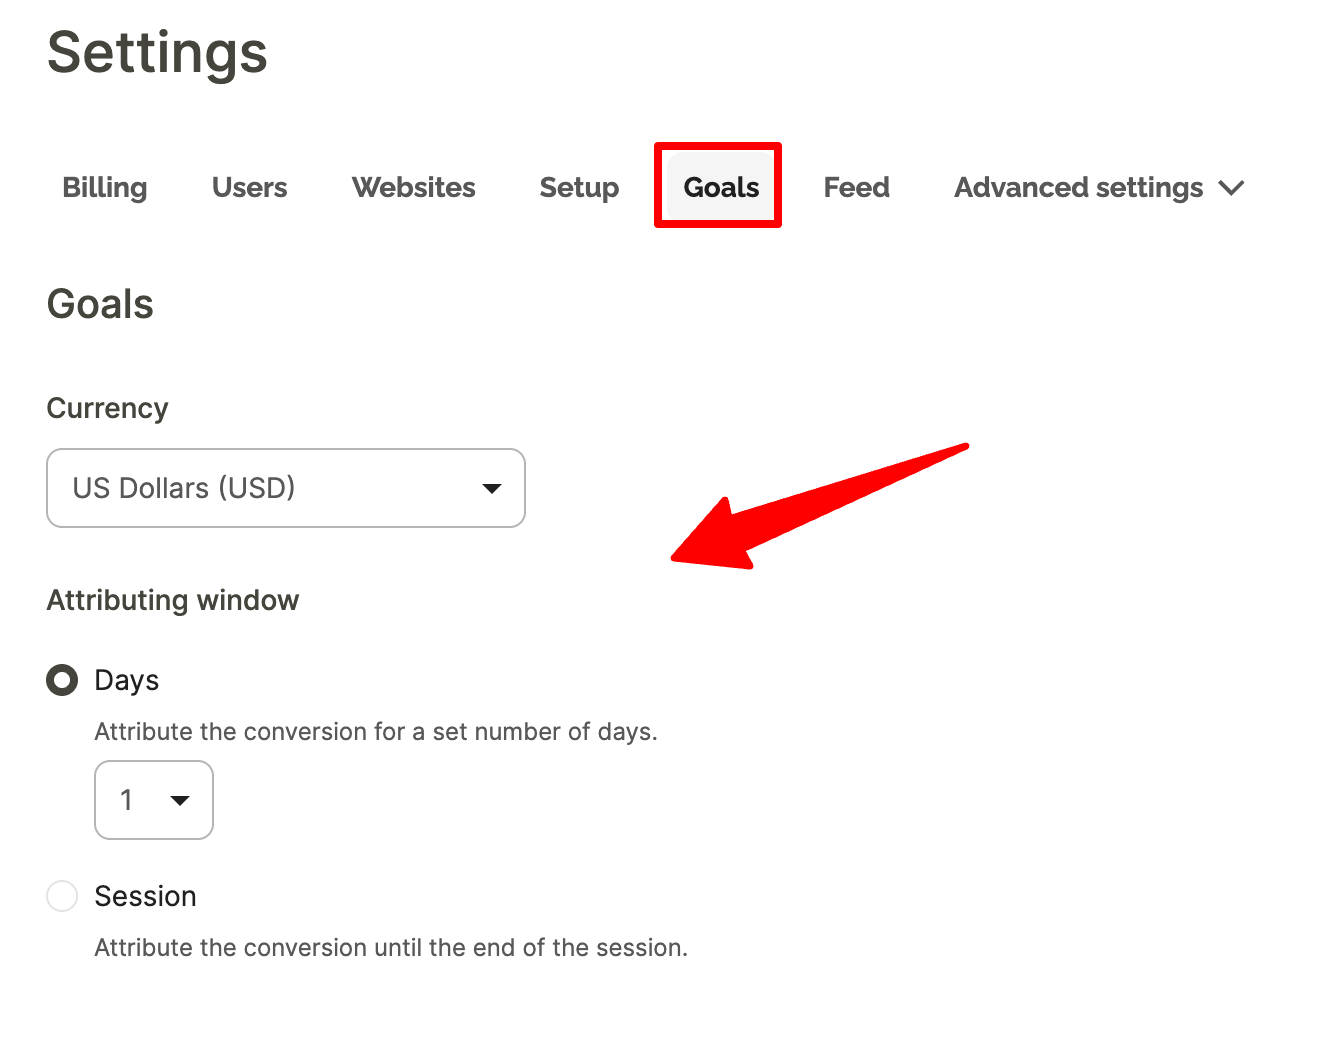
Set up goal tracking before you launch anything
Attribution only starts from the moment goal tracking is configured and assigned to each campaign. If you haven't done this yet, here's how to configure it before going any further.
How long should your attribution window be?
The default in Wisepops is 5 days. We recommend setting it to 2 days instead.
Here's why: a 5-day window will attribute purchases to a campaign even when the visitor had already decided to buy before seeing it — for example, a returning customer who clicks a popup on Monday and completes a repeat order on Friday.
A 2-day window is long enough to capture genuine influence (most purchase decisions happen within 48 hours of a product interaction) while reducing the chance of crediting campaigns for conversions they didn't really drive. It gives you a more defensible number when you're reporting results internally.
Understanding Wisepops revenue metrics
Metric
Definition
Where you see it in Wisepops
Attributed revenue
Revenue from visitors who clicked a tracked CTA and then completed a goal within the attribution window
Campaign dashboard
Total revenue
All revenue from visitors who were exposed to a campaign — whether they clicked or not
Experiments
Revenue per visitor
Total revenue generated per visitor across all revenue-associated goals
Experiments
Incremental revenue
Difference in total revenue per visitor between the campaign group and a control group that saw nothing
Calculated from results of A/B tests
From popup A/B testing to revenue measurement
If you're new to popup A/B testing, this guide covers the full setup process — what to test, how to create variants, and how to read basic results.
Let's focus on measuring actual revenue impact.
Standard A/B testing
It compares two campaign variants against each other using click-based attributed revenue. It tells you which version performs better. What it can't tell you is whether either version is adding revenue compared to showing nothing at all — that requires a control group.
Popup A/B testing with a control group
With a control group, a share of visitors is excluded from seeing any campaign. Wisepops tracks the full behavior of both groups — not just clicks, but sessions, page views, and total revenue across the entire visit.
The difference in revenue per visitor between the two groups is your incremental revenue: what the campaign caused, not just what it correlated with.
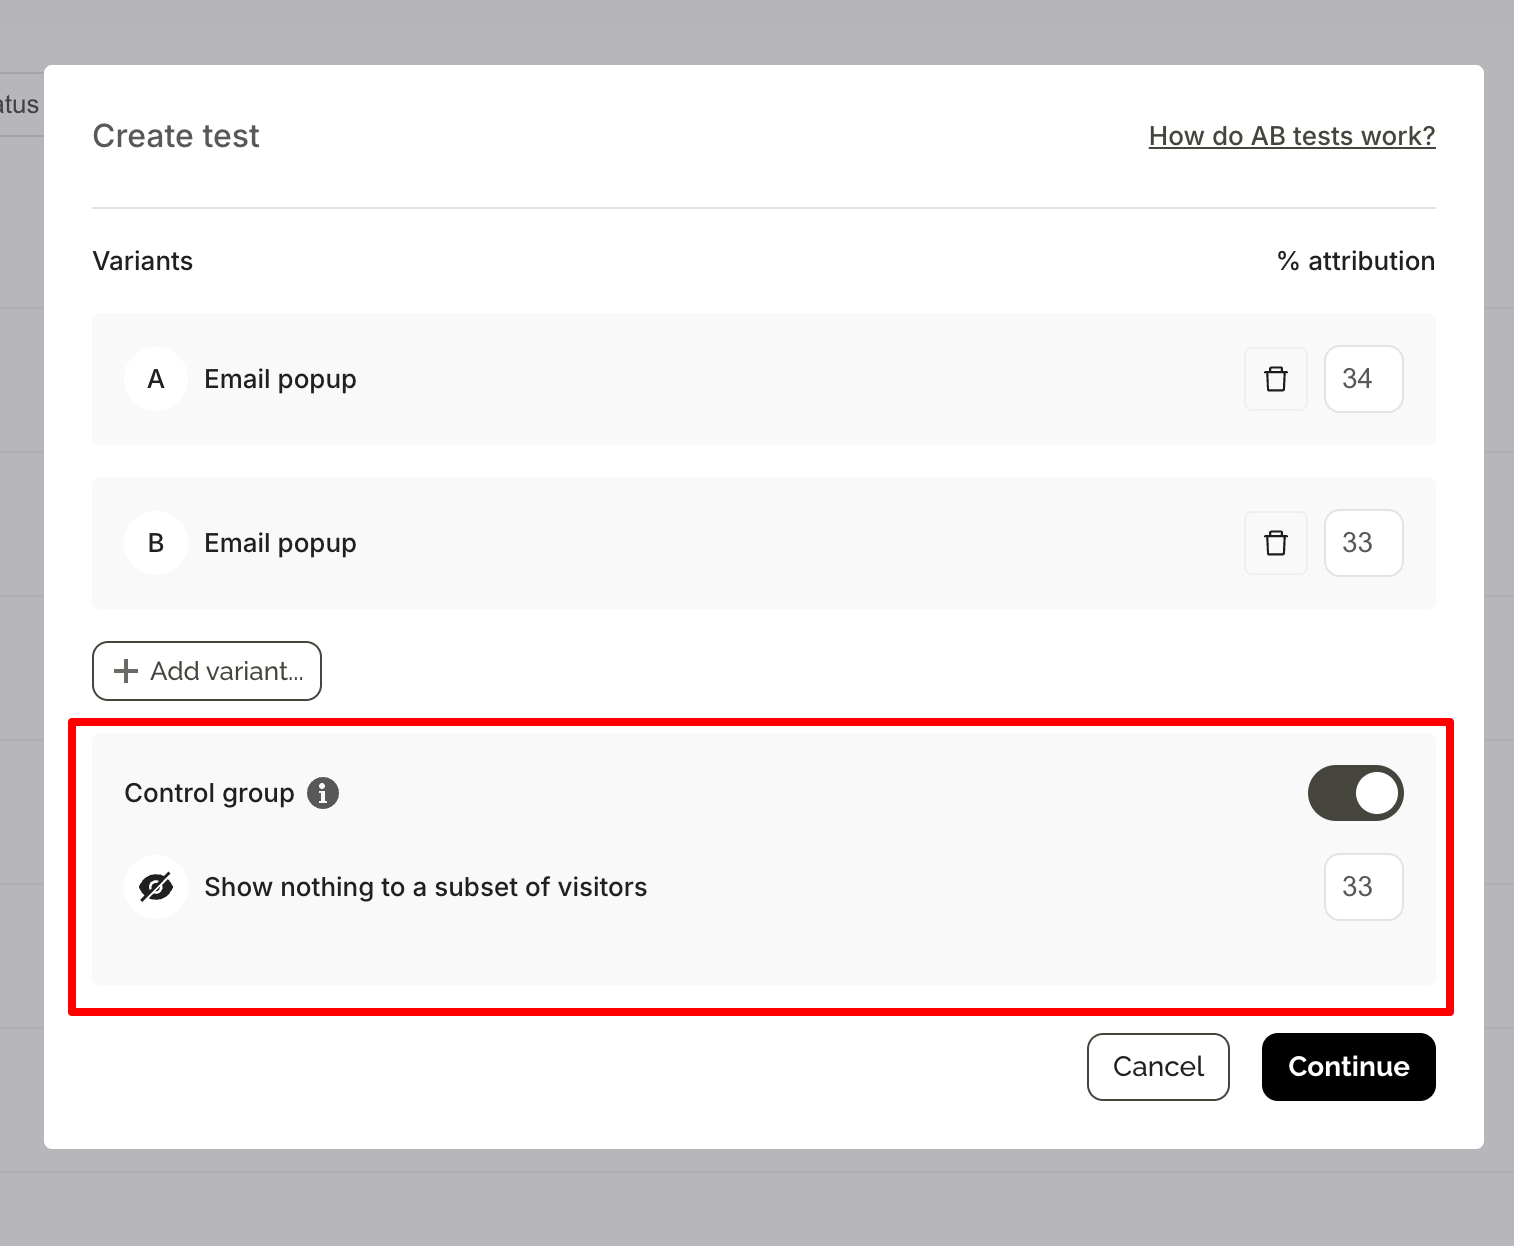
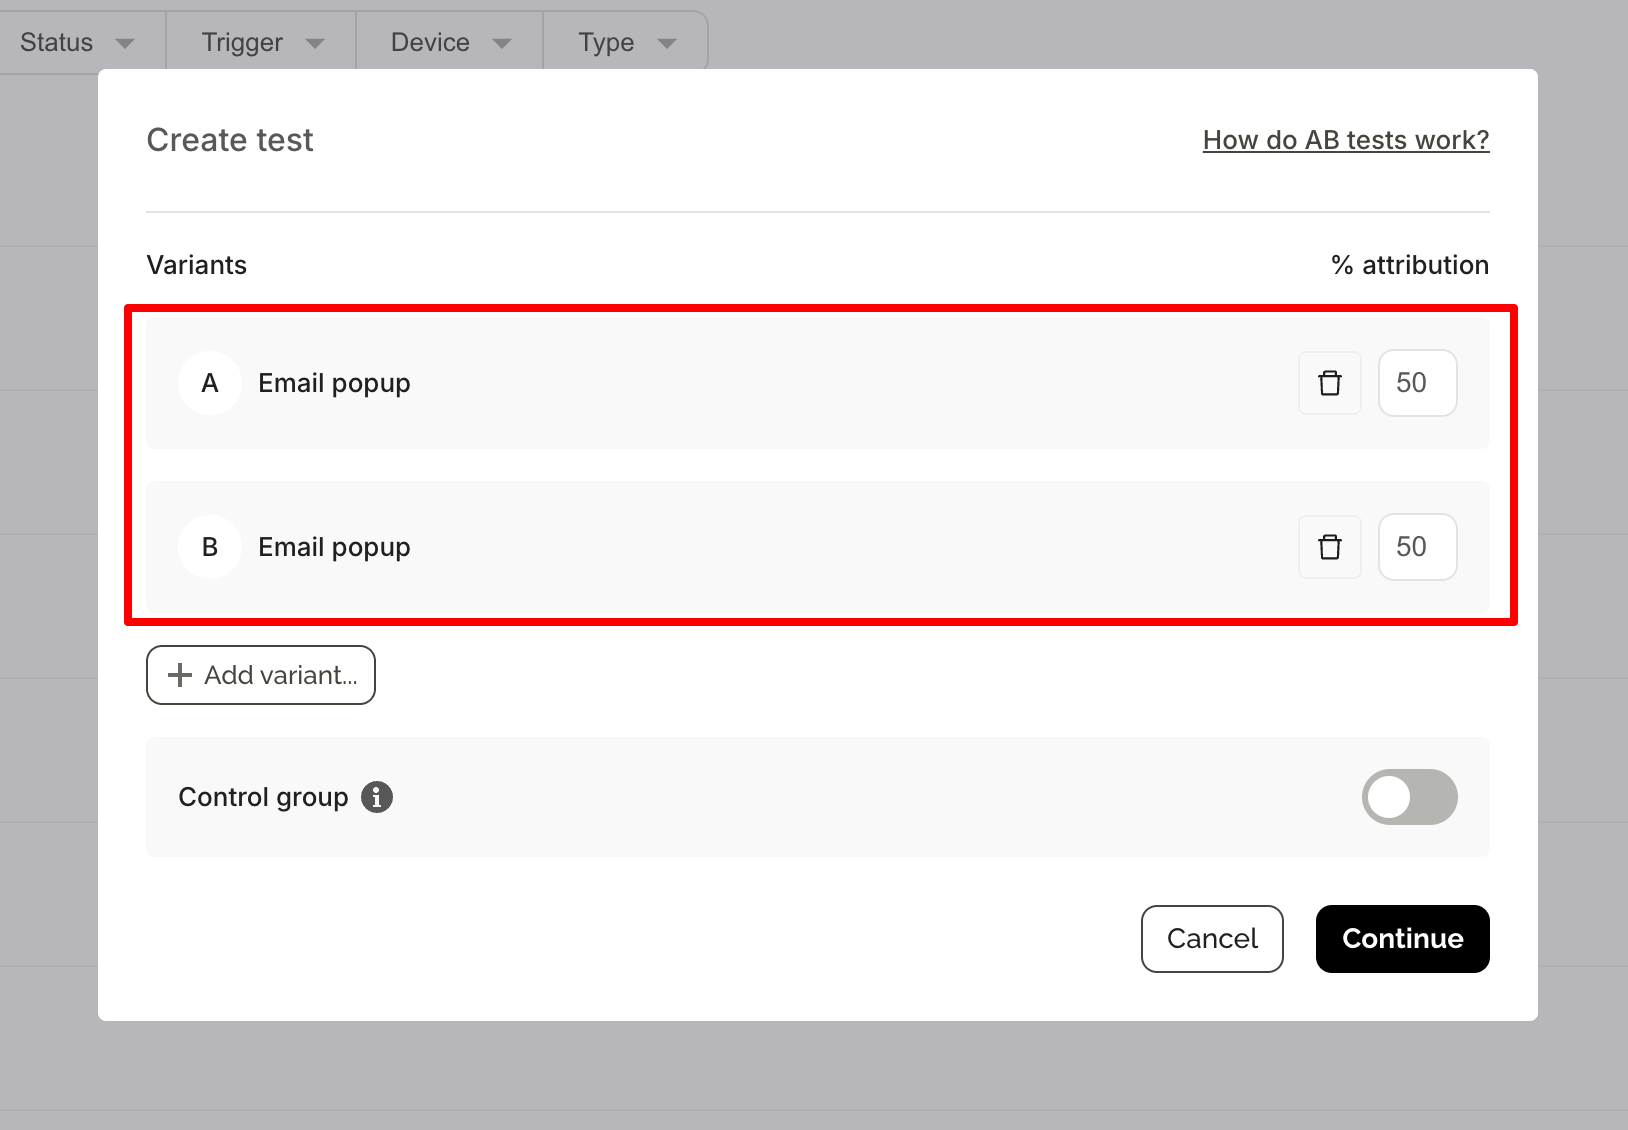
How to set up a control group experiment for popups
When creating an A/B test, toggle on the control group option to set aside a share of visitors who will see nothing.
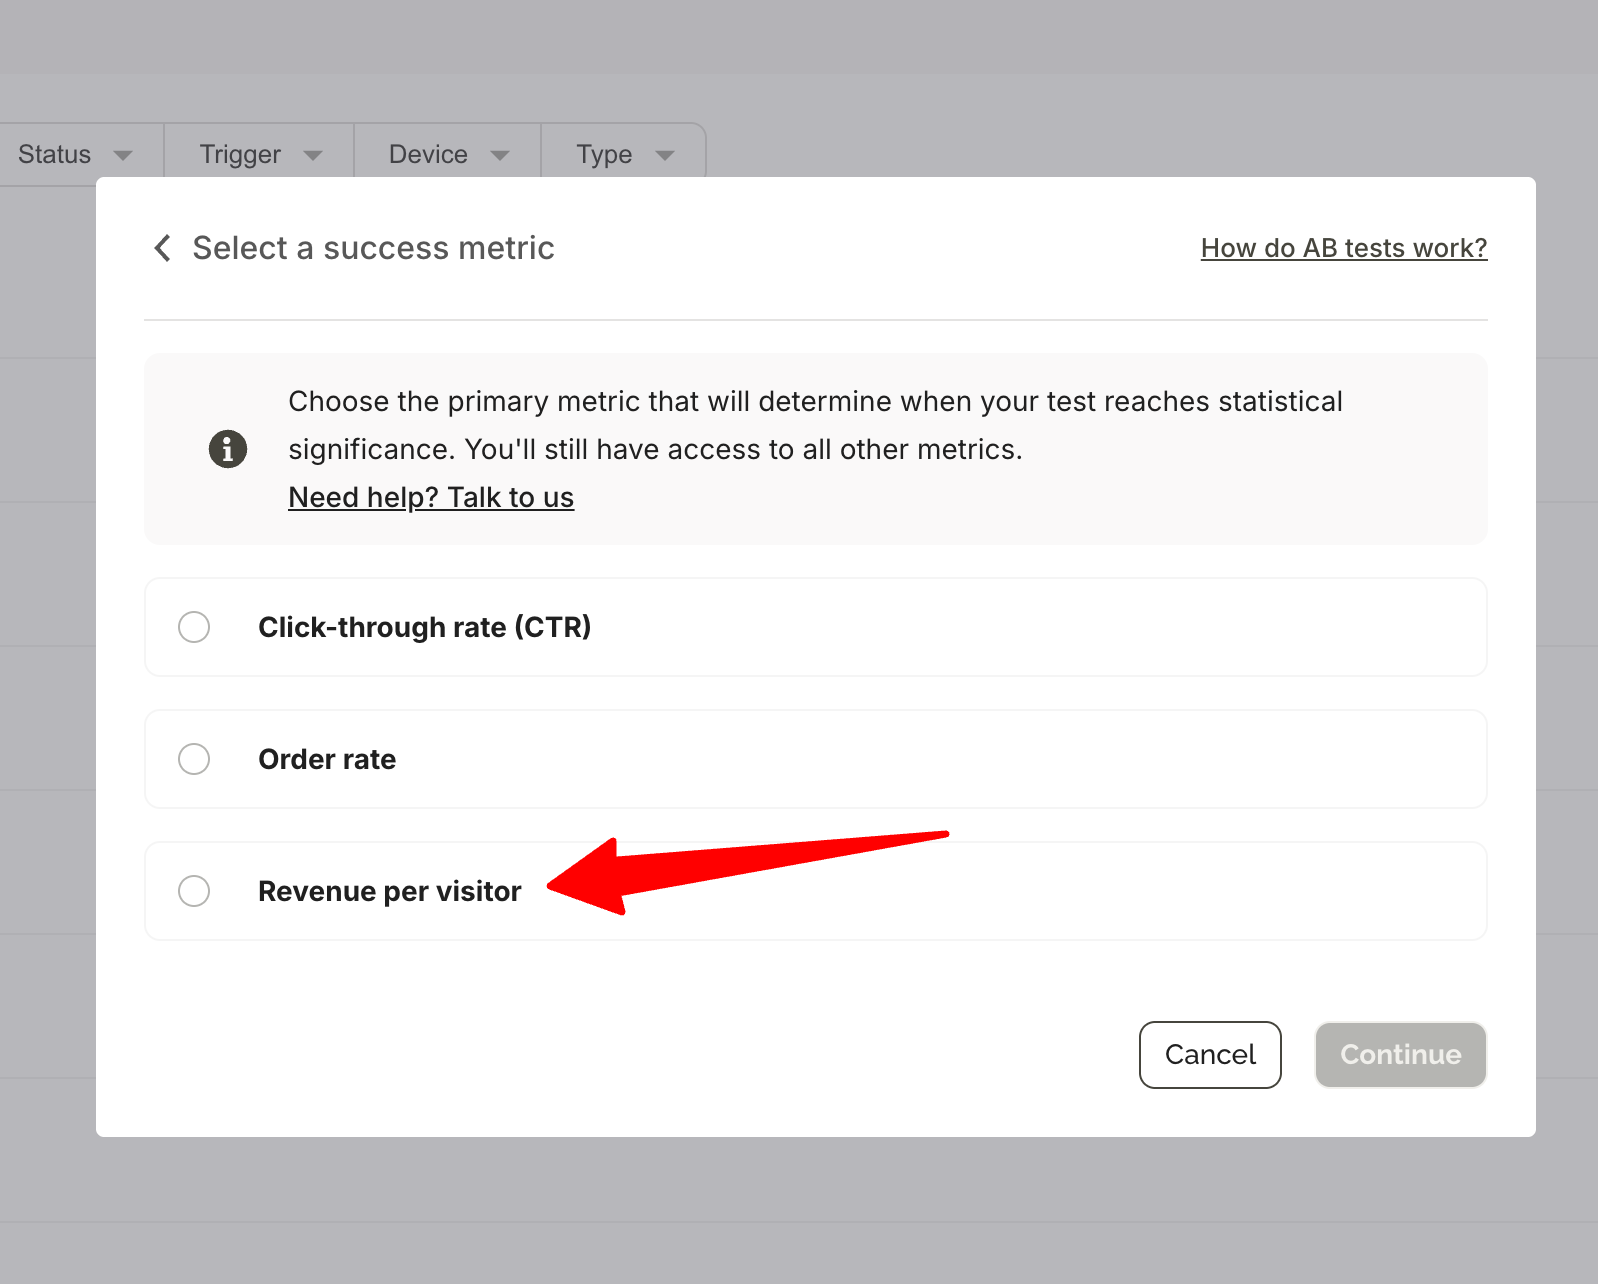
The default split when a control group is enabled is 34% / 33% / 33% (Variant A / Variant B / Control), though this can be adjusted. Select Revenue per visitor as your success metric.
One important detail: the control group follows the same targeting and triggering rules as your campaign. If your popup targets exit-intent visitors from paid traffic, the control group will also be drawn from that same audience — making the comparison fair.
The experiment dashboard becomes accessible 24 hours after launch and updates daily. You'll receive an automated email when the experiment reaches statistical significance at 95% confidence.
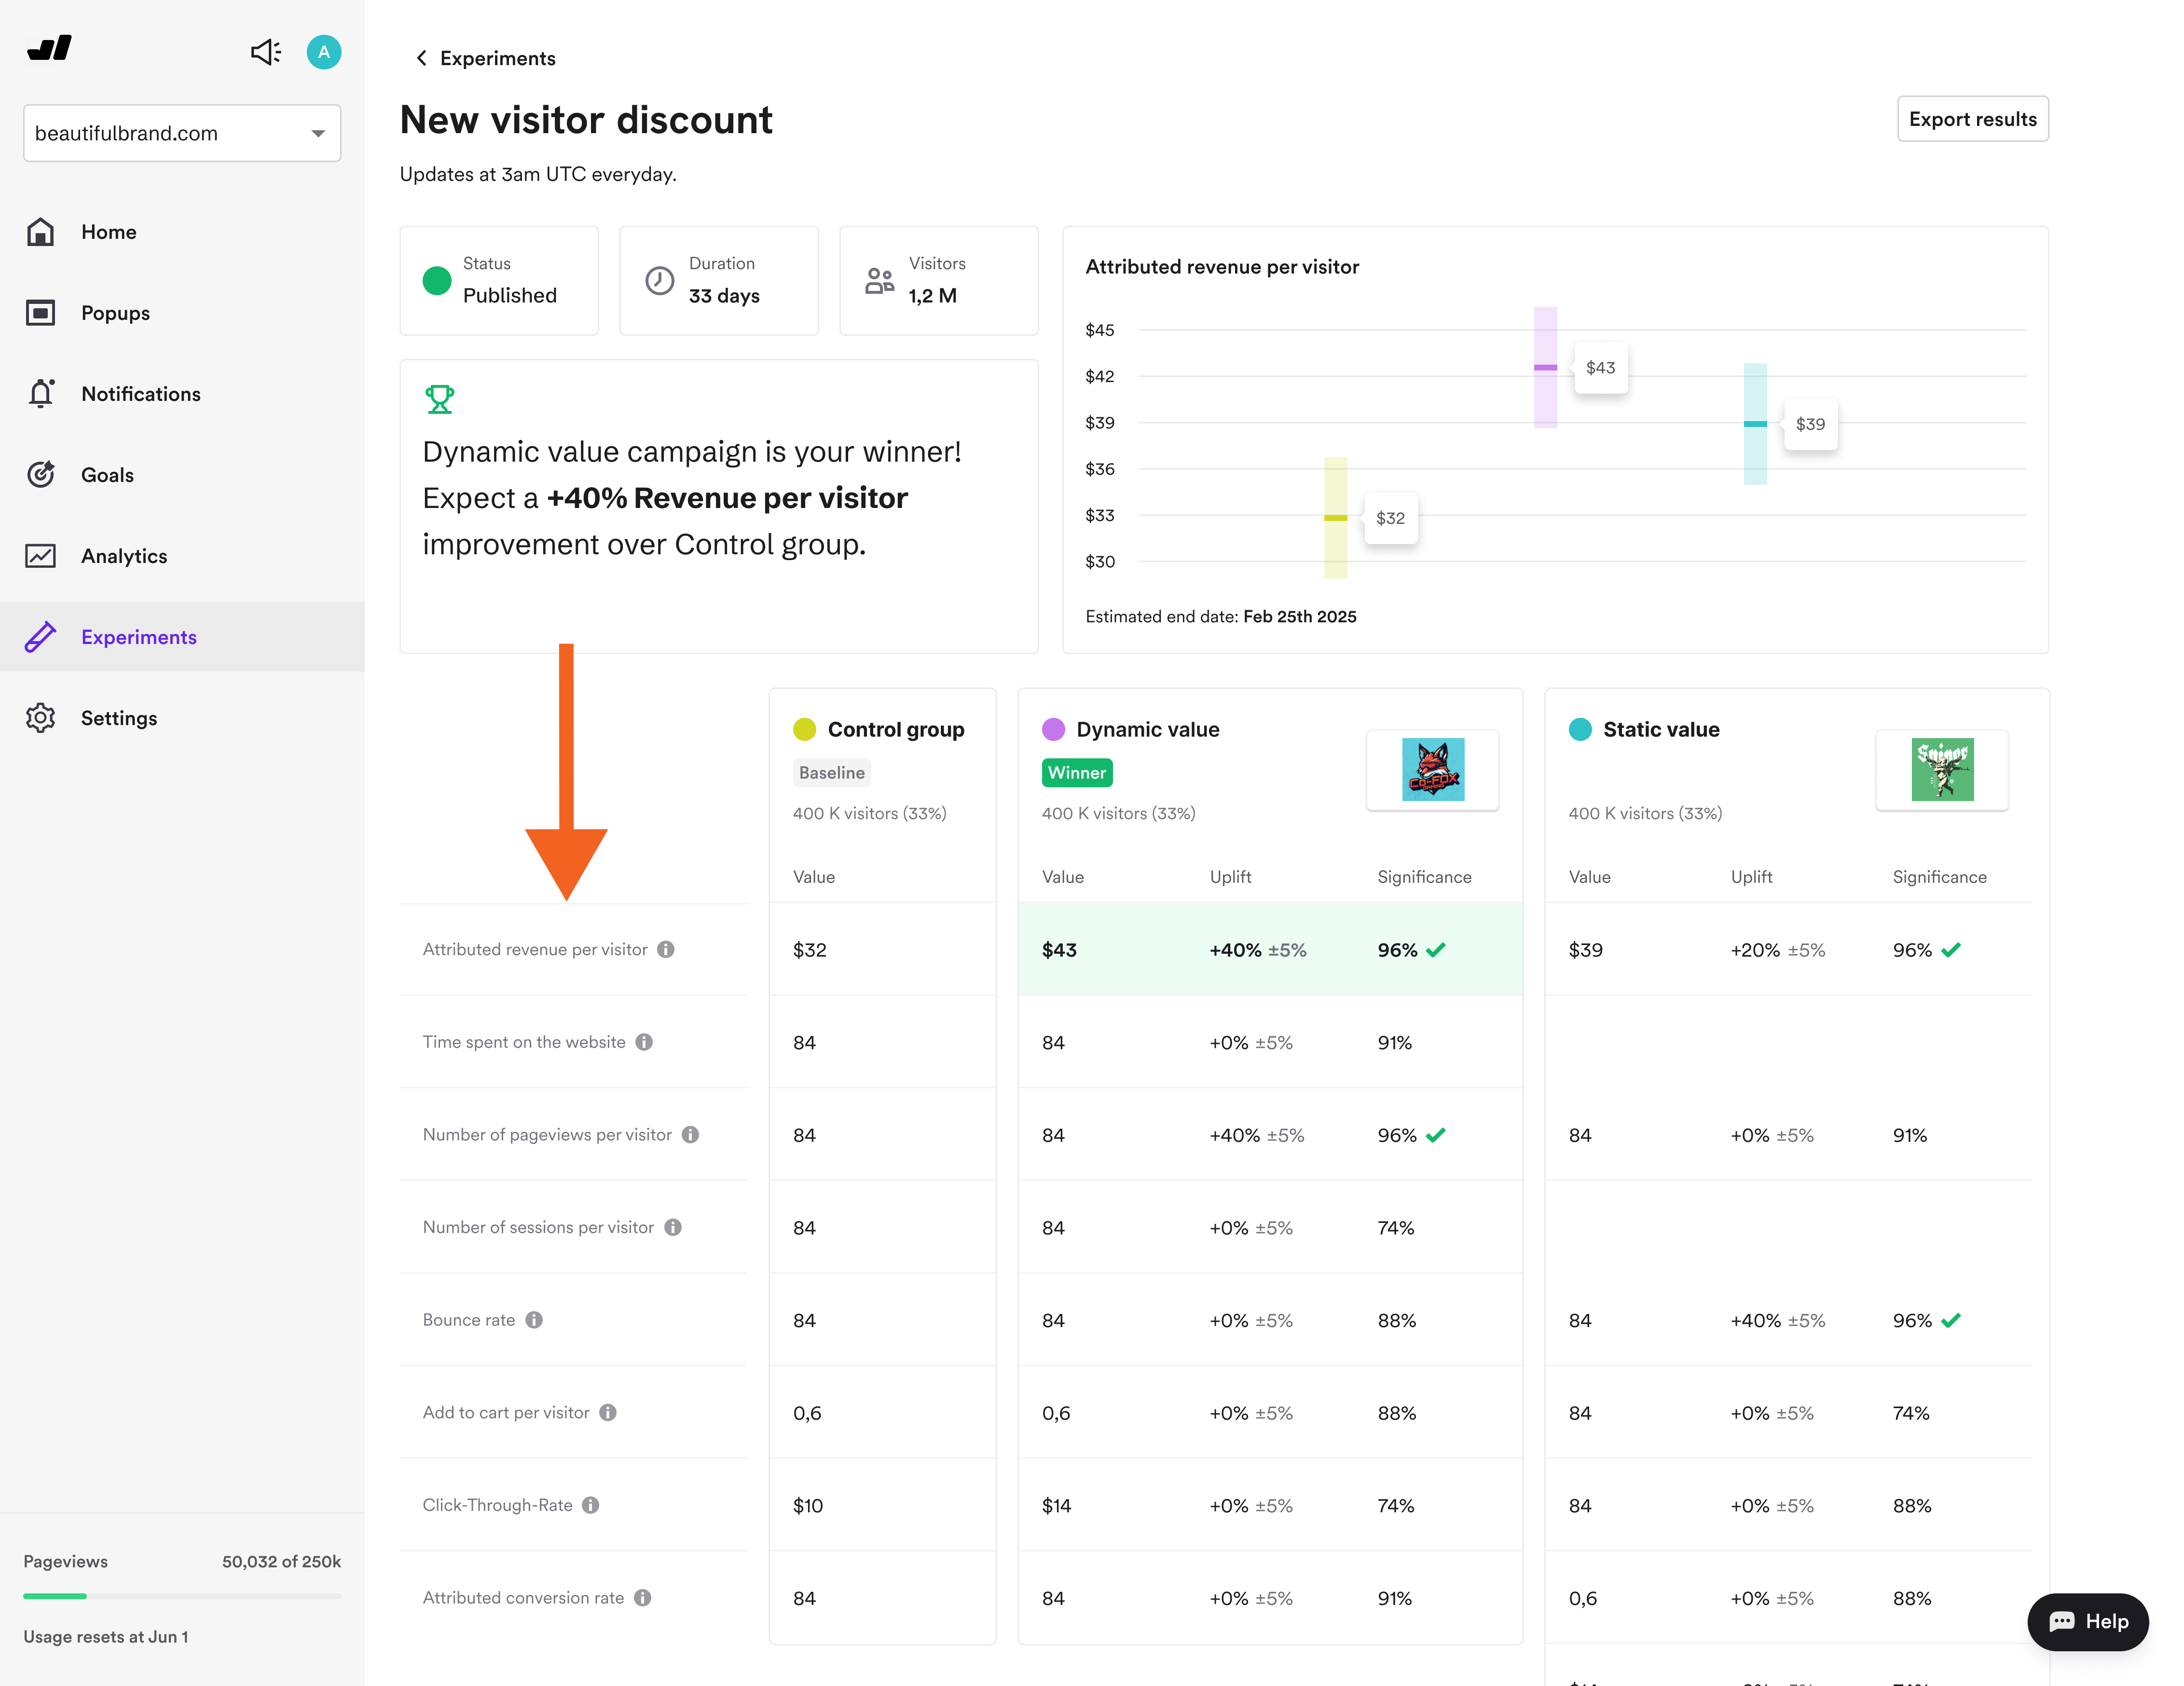
Reading the results of popup A/B tests with control group
The control group is the baseline. All uplift is calculated relative to it.
A +15% uplift in revenue per visitor with a ±5% confidence interval means Wisepops is 95% confident the true uplift falls between +10% and +20%. Wait for the green significance check before making any decisions — results before that point will shift as more visitors accumulate.
If the uplift is small or not statistically significant, the campaign may be capturing revenue that would have happened anyway rather than creating new revenue.
With Detailed Results enabled, you can see what's driving (or not driving) the lift:
Metric
What it tells you
Revenue per visitor
Whether the campaign group spends more in total
Order rate
Whether the campaign drives more orders
Average order value
Whether the campaign increases basket size (Shopify only)
Sessions per visitor
Whether the campaign influences return visits
Bounce rate
Whether the campaign helps or hurts early engagement
All metrics reflect the full visitor journey, including activity before the campaign was displayed.
What to A/B test with revenue per visitor in your popups
Does this popup add revenue or just capture it?
Run any existing lead capture or cart recovery campaign against a control group.
If revenue per visitor is materially higher in the exposed group and statistically significant, the campaign is creating genuine lift. If the gap is small or not significant, you're likely attributing purchases that would have happened anyway.
Do product recommendations increase order value?
Add a product recommendation step after a discount code reveal for one variant, and skip it in the other.
Compare average order value and revenue per visitor. If the recommendation variant generates more revenue per visitor, the step is justified. If not, removing it won't cost you conversions.
Which trigger generates more incremental revenue?
Test exit-intent versus on-landing display of the same campaign, each measured against the control group.
Note: if targeting or triggering rules differ between variants, visitor distribution may not match your intended split — which can skew results. Keep all settings identical except the trigger itself for a clean comparison. The trigger with the larger revenue per visitor uplift is the right one, regardless of which has a higher CTR.
FAQ
Results vary significantly by industry, strategy, and campaign maturity. Best-in-class Wisepops customers running active multi-campaign strategies have attributed 20–24% of total revenue to Wisepops campaigns, with ROI multiples reaching 200x in some cases.
A more realistic starting point for brands actively managing campaigns is around 15% attributed revenue. These figures come from customers using Wisepops across multiple campaign types, not popups in isolation.
In the Experiments Platform's Detailed Results, revenue per visitor is the total revenue generated per visitor across all revenue-associated goals. As a success metric when setting up an experiment, it's defined as the average amount of revenue per visitor. In both cases, it's used to compare spending behavior between visitors who saw a campaign and a control group who saw nothing.
Attributed revenue counts purchases from visitors who clicked a campaign CTA within the attribution window — it shows correlation. Incremental revenue is the difference in total revenue per visitor between an exposed group and a control group that saw nothing — it shows causation. Basic A/B testing uses attributed revenue. Control group experiments measure incremental revenue.
Set up a control group experiment. A share of visitors sees nothing; the rest see your campaign. Compare total revenue per visitor between both groups. The difference — once statistically significant at 95% confidence — is the incremental revenue the campaign drove beyond what visitors would have spent without it.
The default in Wisepops is 5 days. We recommend setting it to 2 days. This is long enough to capture most purchase decisions (which typically happen within 48 hours of engagement) while reducing the chance of attributing purchases to campaigns that didn't actually influence the decision.
Get started
in minutes
Start converting more visitors today.
Get started in minutes and see results right after.