


Read summarized version with
 ChatGPT
'%3e%3cpath%20fill-rule='evenodd'%20clip-rule='evenodd'%20d='M16.4875%200V6.06H18.75V14.6833H16.3042V20L10.44%2014.8383V19.9592H9.53083V14.8325L3.66%2020V14.6125H1.25V5.99H3.65333V0L9.53083%205.41167V0.158333H10.4392V5.56667L16.4875%200ZM10.44%207.53667V13.6358L15.395%2017.9975V12.0333L10.44%207.53667ZM9.52417%207.47L4.56917%2011.9683V17.9975L9.52417%2013.6358V7.47083V7.47ZM16.3042%2013.7867H17.8408V6.9575H11.2167L16.3042%2011.5742V13.7867ZM8.81917%206.88667H2.15833V13.7158H3.65833V11.5692L8.81833%206.88583L8.81917%206.88667ZM4.5625%202.06333V5.98833H8.825L4.5625%202.06333ZM15.5783%202.06333L11.3158%205.98833H15.5783V2.06333Z'%20fill='black'/%3e%3c/g%3e%3cdefs%3e%3cclipPath%20id='clip0_4212_18220'%3e%3crect%20width='20'%20height='20'%20fill='white'/%3e%3c/clipPath%3e%3c/defs%3e%3c/svg%3e) Perplexity
Perplexity'%3e%3cpath%20d='M9.996%2019.992C9.996%2018.6068%209.73182%2017.3074%209.19632%2016.0936C8.68224%2014.8798%207.96824%2013.8159%207.0686%2012.9163C6.16896%2012.0166%205.11224%2011.3098%203.89844%2010.7957C2.68464%2010.2602%201.38516%209.996%200%209.996C1.38516%209.996%202.68464%209.73896%203.89844%209.21774C5.11224%208.68224%206.1761%207.96824%207.0686%207.0686C7.96824%206.16896%208.6751%205.11224%209.19632%203.89844C9.73182%202.68464%209.996%201.38516%209.996%200C9.996%201.38516%2010.253%202.68464%2010.7743%203.89844C11.3098%205.11224%2012.0238%206.1761%2012.9234%207.0686C13.823%207.96824%2014.8798%208.68224%2016.1007%209.21774C17.3145%209.73182%2018.614%209.996%2019.9991%209.996C18.614%209.996%2017.3145%2010.2602%2016.1007%2010.7957C14.8869%2011.3098%2013.823%2012.0166%2012.9234%2012.9163C12.0238%2013.8159%2011.3098%2014.8726%2010.7743%2016.0936C10.2538%2017.327%209.98905%2018.6533%209.996%2019.992Z'%20fill='url(%23paint0_radial_4212_18233)'/%3e%3c/g%3e%3cdefs%3e%3cradialGradient%20id='paint0_radial_4212_18233'%20cx='0'%20cy='0'%20r='1'%20gradientUnits='userSpaceOnUse'%20gradientTransform='translate(-1.13275%205.96185)%20rotate(18.68)%20scale(21.2772%20170.46)'%3e%3cstop%20offset='0.07'%20stop-color='%239168C0'/%3e%3cstop%20offset='0.34'%20stop-color='%235684D1'/%3e%3cstop%20offset='0.67'%20stop-color='%231BA1E3'/%3e%3c/radialGradient%3e%3cclipPath%20id='clip0_4212_18233'%3e%3crect%20width='20'%20height='19.992'%20fill='white'/%3e%3c/clipPath%3e%3c/defs%3e%3c/svg%3e) Gemini
Gemini'%3e%3cpath%20d='M3.92888%2013.2962L7.86008%2011.0903L7.92585%2010.8981L7.86008%2010.7918H7.66782L7.01009%2010.7513L4.76369%2010.6906L2.81581%2010.6097L0.928632%2010.5085L0.453044%2010.4073L0.0078125%209.82039L0.0533475%209.52694L0.453044%209.25879L1.02476%209.30939L2.28962%209.3954L4.18692%209.52694L5.56309%209.60789L7.60204%209.82039H7.92585L7.97138%209.68884L7.86008%209.60789L7.77407%209.52694L5.811%208.19631L3.68603%206.78978L2.57295%205.98027L1.97088%205.57045L1.66731%205.18593L1.53577%204.34607L2.08219%203.74399L2.81581%203.79459L3.00301%203.84518L3.74674%204.4169L5.33541%205.64634L7.40979%207.1743L7.71335%207.42727L7.83478%207.34126L7.84996%207.28055L7.71335%207.05287L6.5851%205.01391L5.38095%202.93954L4.84465%202.07943L4.70298%201.56337C4.65239%201.35087%204.61697%201.17379%204.61697%200.956236L5.23928%200.111308L5.58332%200L6.41307%200.111308L6.76218%200.414875L7.27824%201.59373L8.11305%203.45054L9.40827%205.97521L9.78773%206.72401L9.9901%207.41715L10.066%207.62965H10.1975V7.50822L10.3038%206.08652L10.5011%204.34101L10.6934%202.09461L10.7591%201.46218L11.0728%200.703263L11.6951%200.293448L12.1808%200.526183L12.5805%201.0979L12.5249%201.46724L12.2871%203.01037L11.8216%205.42879L11.5181%207.04781H11.6951L11.8975%206.84543L12.7171%205.75765L14.0933%204.03744L14.7005%203.35441L15.4088%202.60056L15.8641%202.24134H16.7242L17.3567%203.18239L17.0733%204.15381L16.1879%205.277L15.4543%206.22818L14.4019%207.64483L13.7442%208.77814L13.8049%208.86921L13.9618%208.85403L16.3397%208.34809L17.6248%208.11536L19.1578%207.85226L19.851%208.17607L19.9269%208.50493L19.6537%209.17784L18.0144%209.5826L16.0918%209.96711L13.2282%2010.6451L13.1927%2010.6704L13.2332%2010.721L14.5234%2010.8424L15.0749%2010.8728H16.4257L18.9403%2011.06L19.598%2011.4951L19.9926%2012.0263L19.9269%2012.4311L18.915%2012.9471L17.5489%2012.6233L14.3615%2011.8644L13.2686%2011.5912H13.1168V11.6823L14.0275%2012.5727L15.6972%2014.0804L17.7867%2016.0233L17.893%2016.5039L17.6248%2016.8834L17.3415%2016.8429L15.5049%2015.4617L14.7966%2014.8394L13.1927%2013.4885H13.0865V13.6302L13.4558%2014.1715L15.4088%2017.106L15.51%2018.0066L15.3683%2018.3L14.8624%2018.4771L14.3058%2018.3759L13.1624%2016.7721L11.9835%2014.9658L11.0324%2013.3468L10.916%2013.4126L10.3544%2019.4586L10.0913%2019.7673L9.48416%2020L8.97821%2019.6155L8.71006%2018.9932L8.97821%2017.7637L9.30202%2016.1599L9.56511%2014.8849L9.80291%2013.3013L9.94457%2012.7751L9.93445%2012.7397L9.81808%2012.7549L8.62405%2014.3941L6.80771%2016.848L5.37083%2018.386L5.02679%2018.5226L4.42977%2018.214L4.48542%2017.6625L4.81935%2017.1718L6.80771%2014.642L8.0068%2013.0736L8.7809%2012.168L8.77584%2012.0364H8.7303L3.44824%2015.4667L2.50718%2015.5882L2.10242%2015.2087L2.15302%2014.5864L2.34528%2014.384L3.93394%2013.2912L3.92888%2013.2962Z'%20fill='%23D97757'/%3e%3c/g%3e%3cdefs%3e%3cclipPath%20id='clip0_4212_18270'%3e%3crect%20width='20'%20height='20'%20fill='white'/%3e%3c/clipPath%3e%3c/defs%3e%3c/svg%3e) Claude
Claude'%3e%3cpath%20d='M7.77353%2012.0388L14.278%207.23827C14.5972%207.00347%2015.0534%207.09396%2015.205%207.46044C16.0048%209.38782%2015.6469%2011.7045%2014.0559%2013.296C12.4648%2014.8862%2010.2512%2015.2348%208.22684%2014.4407L6.01614%2015.4643C9.18686%2017.631%2013.0375%2017.0949%2015.4431%2014.6885C17.3517%2012.7811%2017.9424%2010.1807%2017.3896%207.83507L17.3941%207.83956C16.5927%204.39408%2017.5906%203.01744%2019.6366%200.202196C19.6839%200.135341%2019.7332%200.0676703%2019.7821%200L17.0908%202.6901V2.68113L7.7719%2012.04M6.43072%2013.2047C4.15521%2011.0323%204.54778%207.66916%206.48861%205.72874C7.92395%204.29299%2010.2773%203.7076%2012.3307%204.56815L14.5369%203.55024C14.1398%203.26326%2013.6303%202.95507%2013.0453%202.73738C10.4045%201.65058%207.24114%202.19113%205.09403%204.3362C3.02927%206.40055%202.37948%209.57493%203.49441%2012.2838C4.32765%2014.3078%202.9616%2015.7407%201.58578%2017.185C1.097%2017.6966%200.609043%2018.2098%200.214844%2018.752L6.42787%2013.2047'%20fill='black'/%3e%3c/g%3e%3cdefs%3e%3cclipPath%20id='clip0_4212_18265'%3e%3crect%20width='20'%20height='18.752'%20fill='white'/%3e%3c/clipPath%3e%3c/defs%3e%3c/svg%3e) Grok
GrokOur latest 2026 popup statistics report is here!
As we do every year, we analyzed popup displays across all Wisepops popup platform users who run campaigns with a signup field to bring you actionable insights into how online businesses convert visitors.
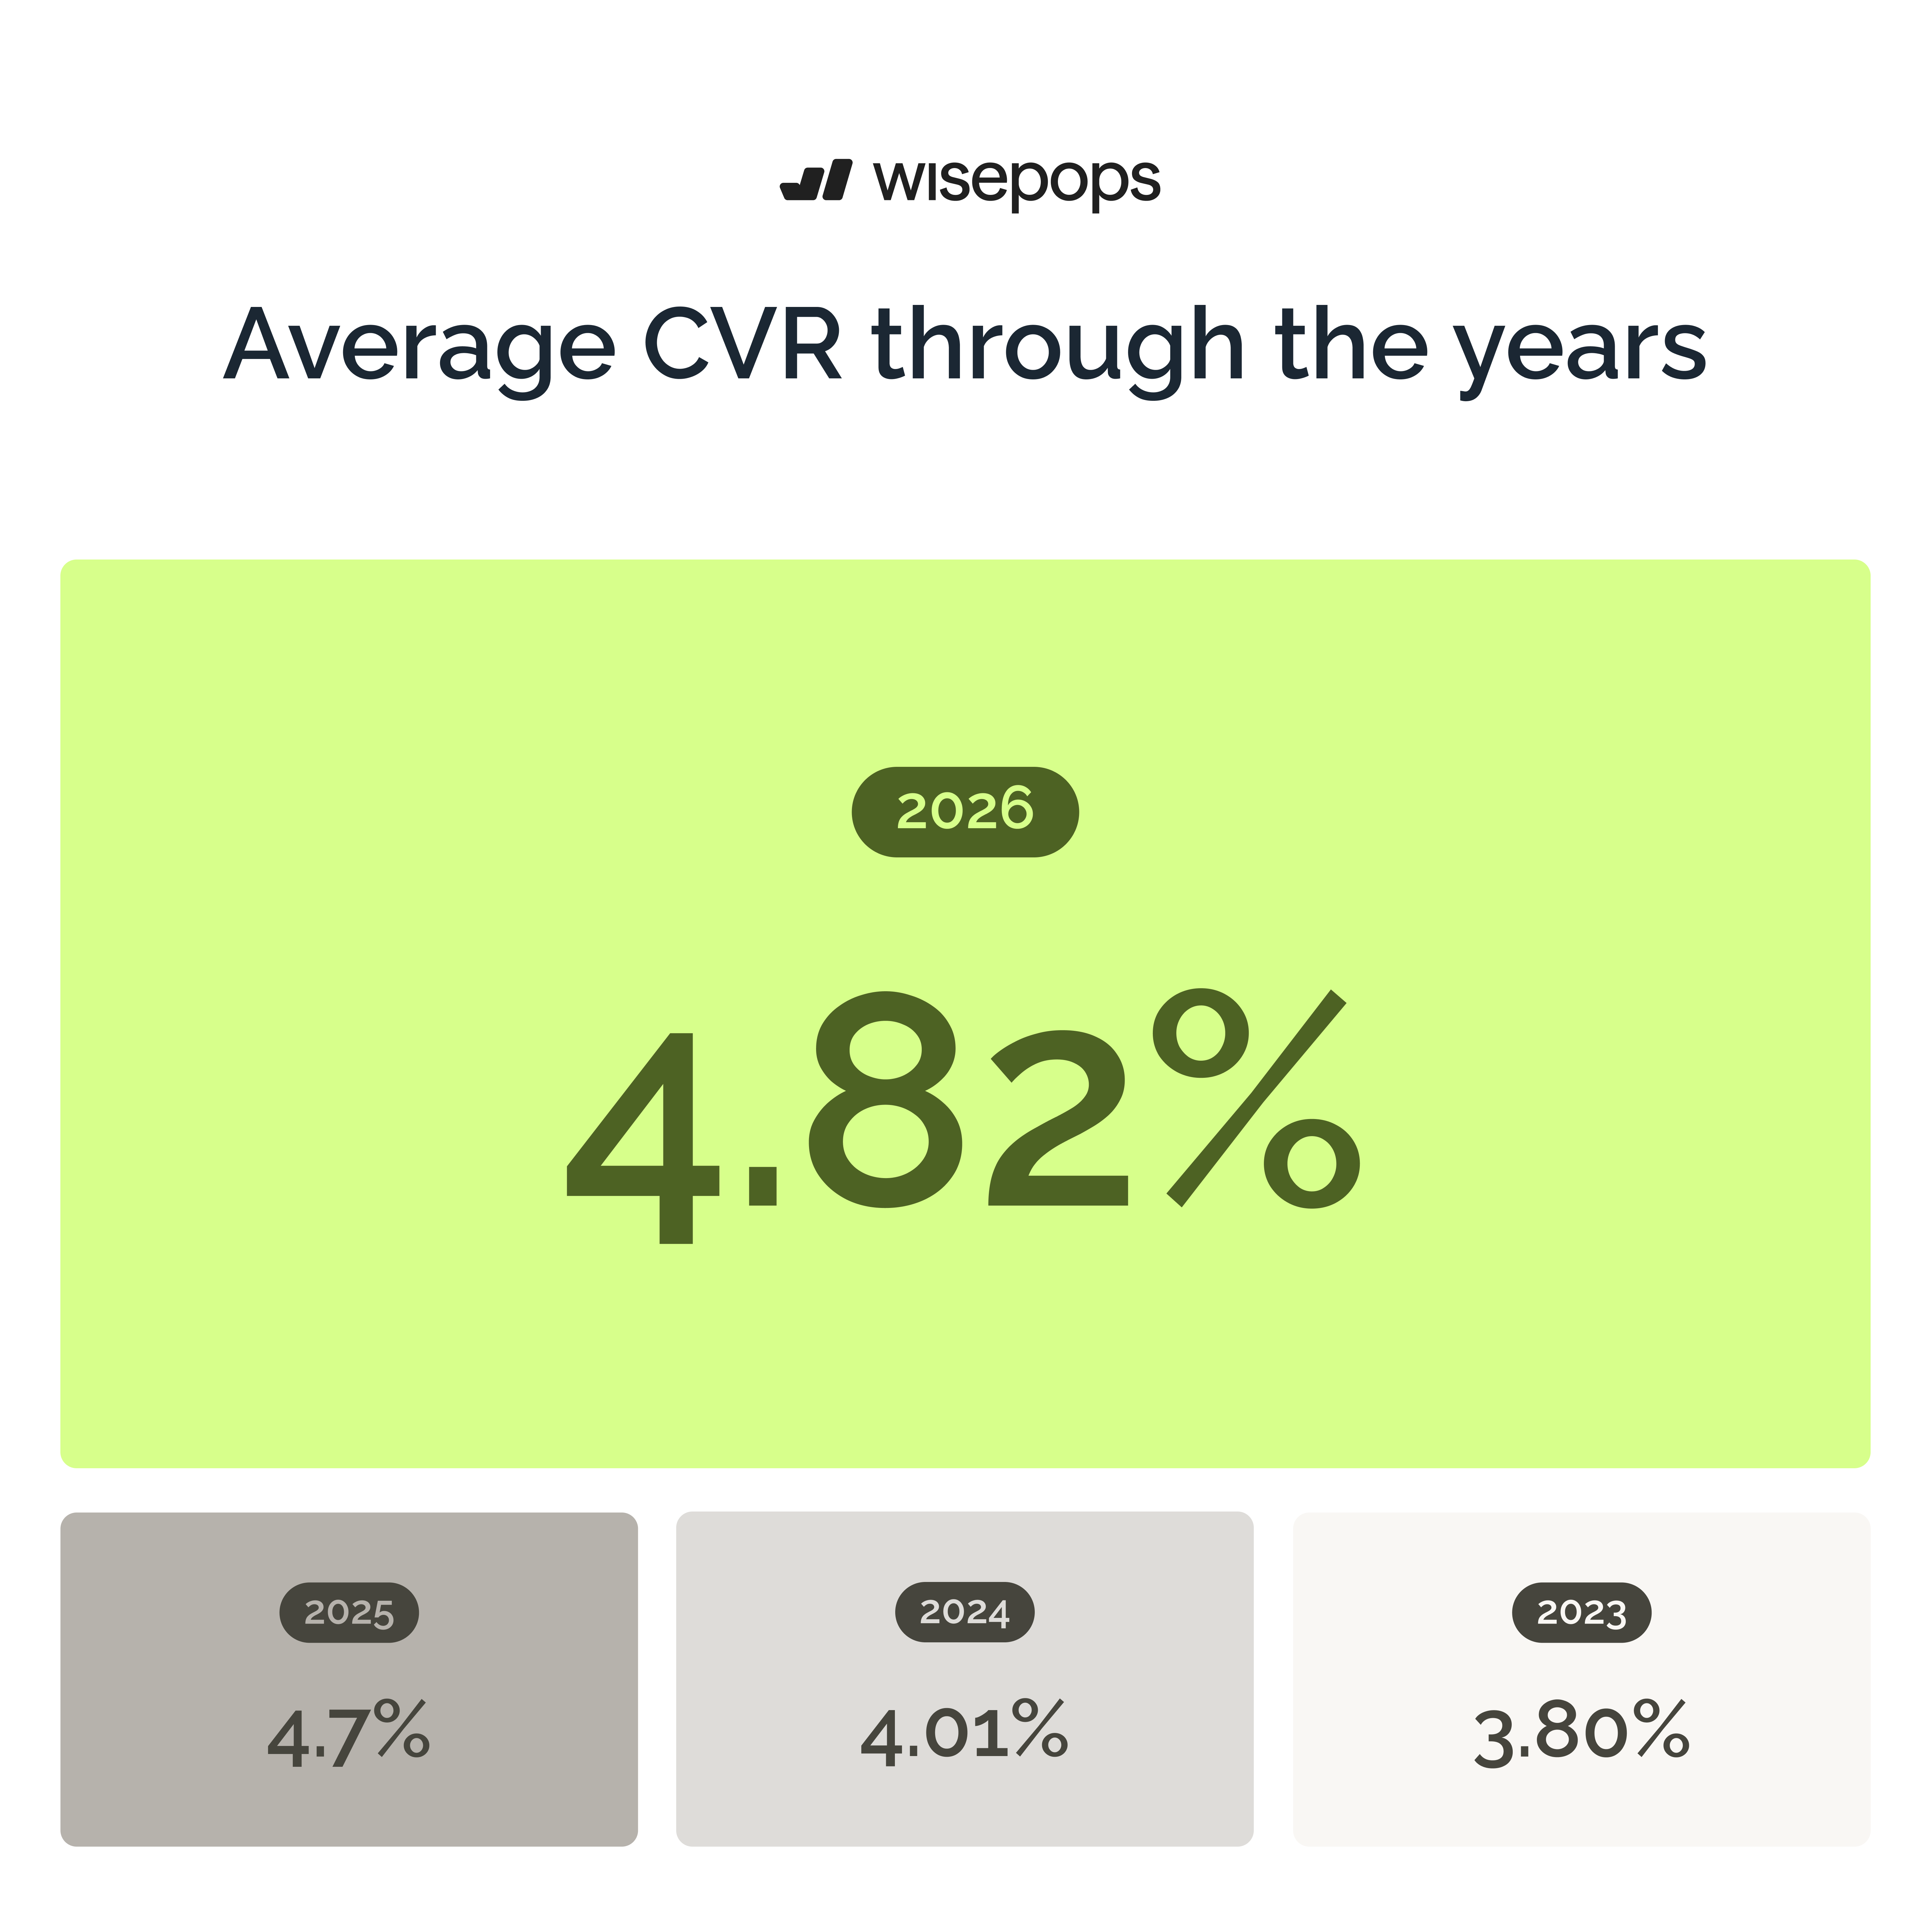
Online businesses are getting better at using targeting to make campaigns that are more personalized and relevant, as we see a higher average conversion rate (CVR) this year compared to 2025.
As always, we also differentiated the data from the 10% top-performing campaigns to show that using the best onsite marketing practices pays off.
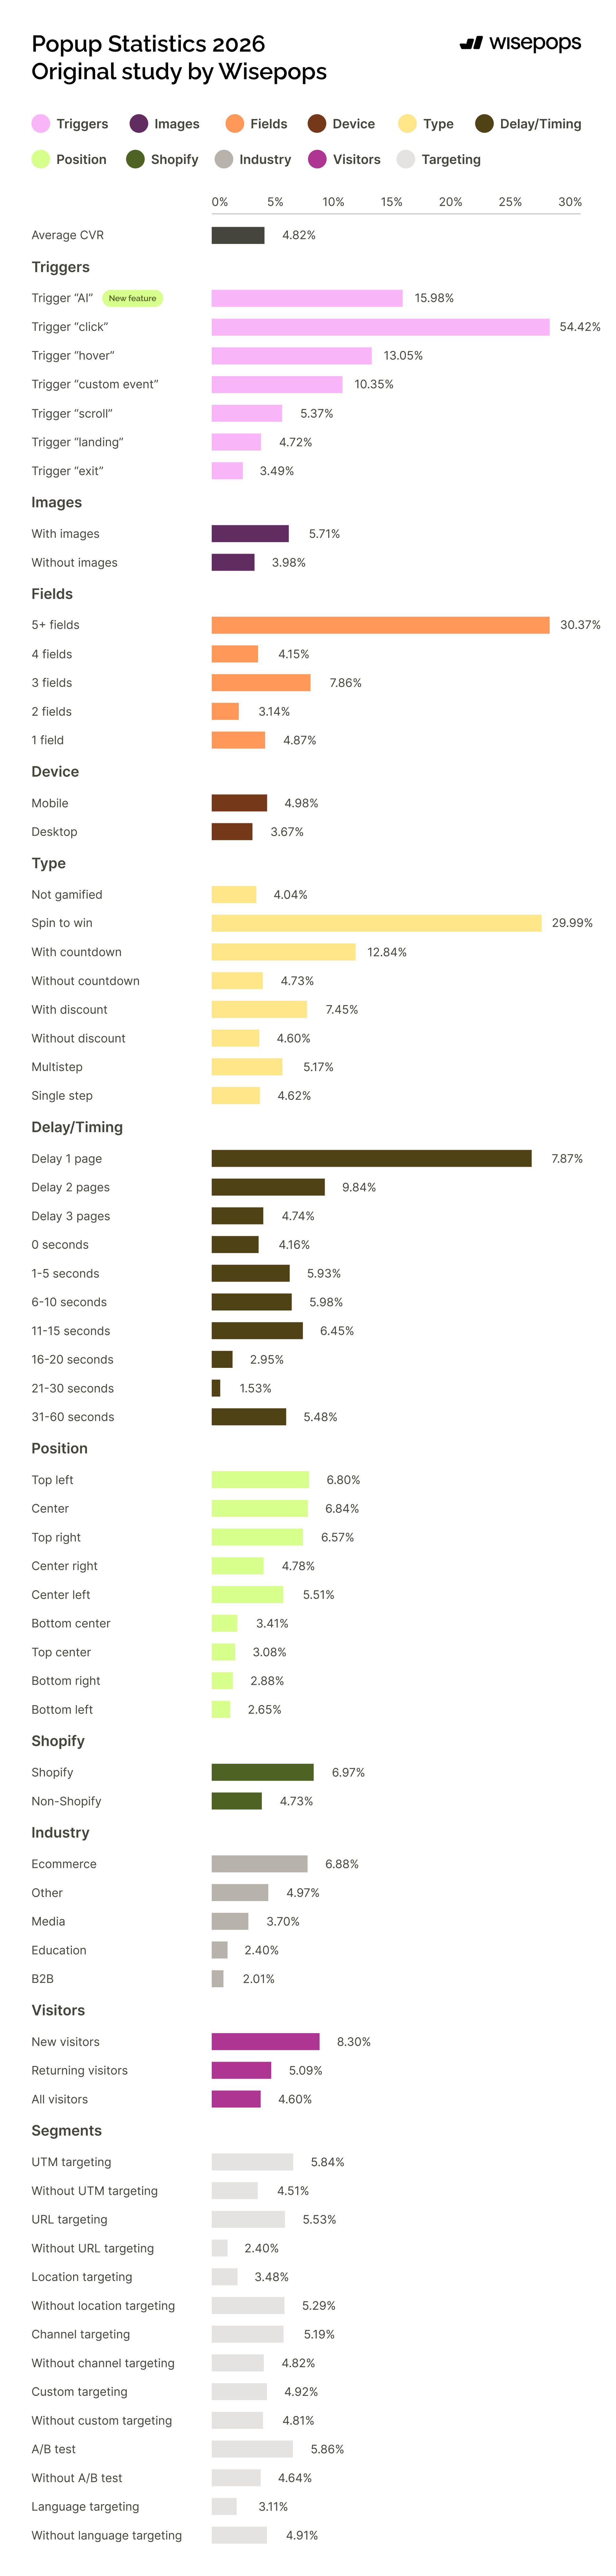
The average popup CVR in 2026 is 4.82%, but we took a deep dive into all the factors that could influence this performance—both general ones like the trigger or whether the visitors were new or returning, whether a discount code was used, as well as more advanced options such as delay, on-page position, geolocation, etc.
Here's the full breakdown:
Note: In this report, we present only data from email signup popups, and CVR is calculated as the number of emails collected divided by the number of displays.
Capture more leads and revenue with a top popup platform
Get 150+ proven templates, AI product recommendations, native Shopify integration, and advanced targeting rules.
Popup statistics 2026
The average conversion rate of popups is 4.82%
The average conversion rate of popups is 4.82% in 2026, which represents an increase from the last report's average of 4.65%. This upward trend demonstrates that website popups remain a highly effective onsite conversion channel for online businesses.
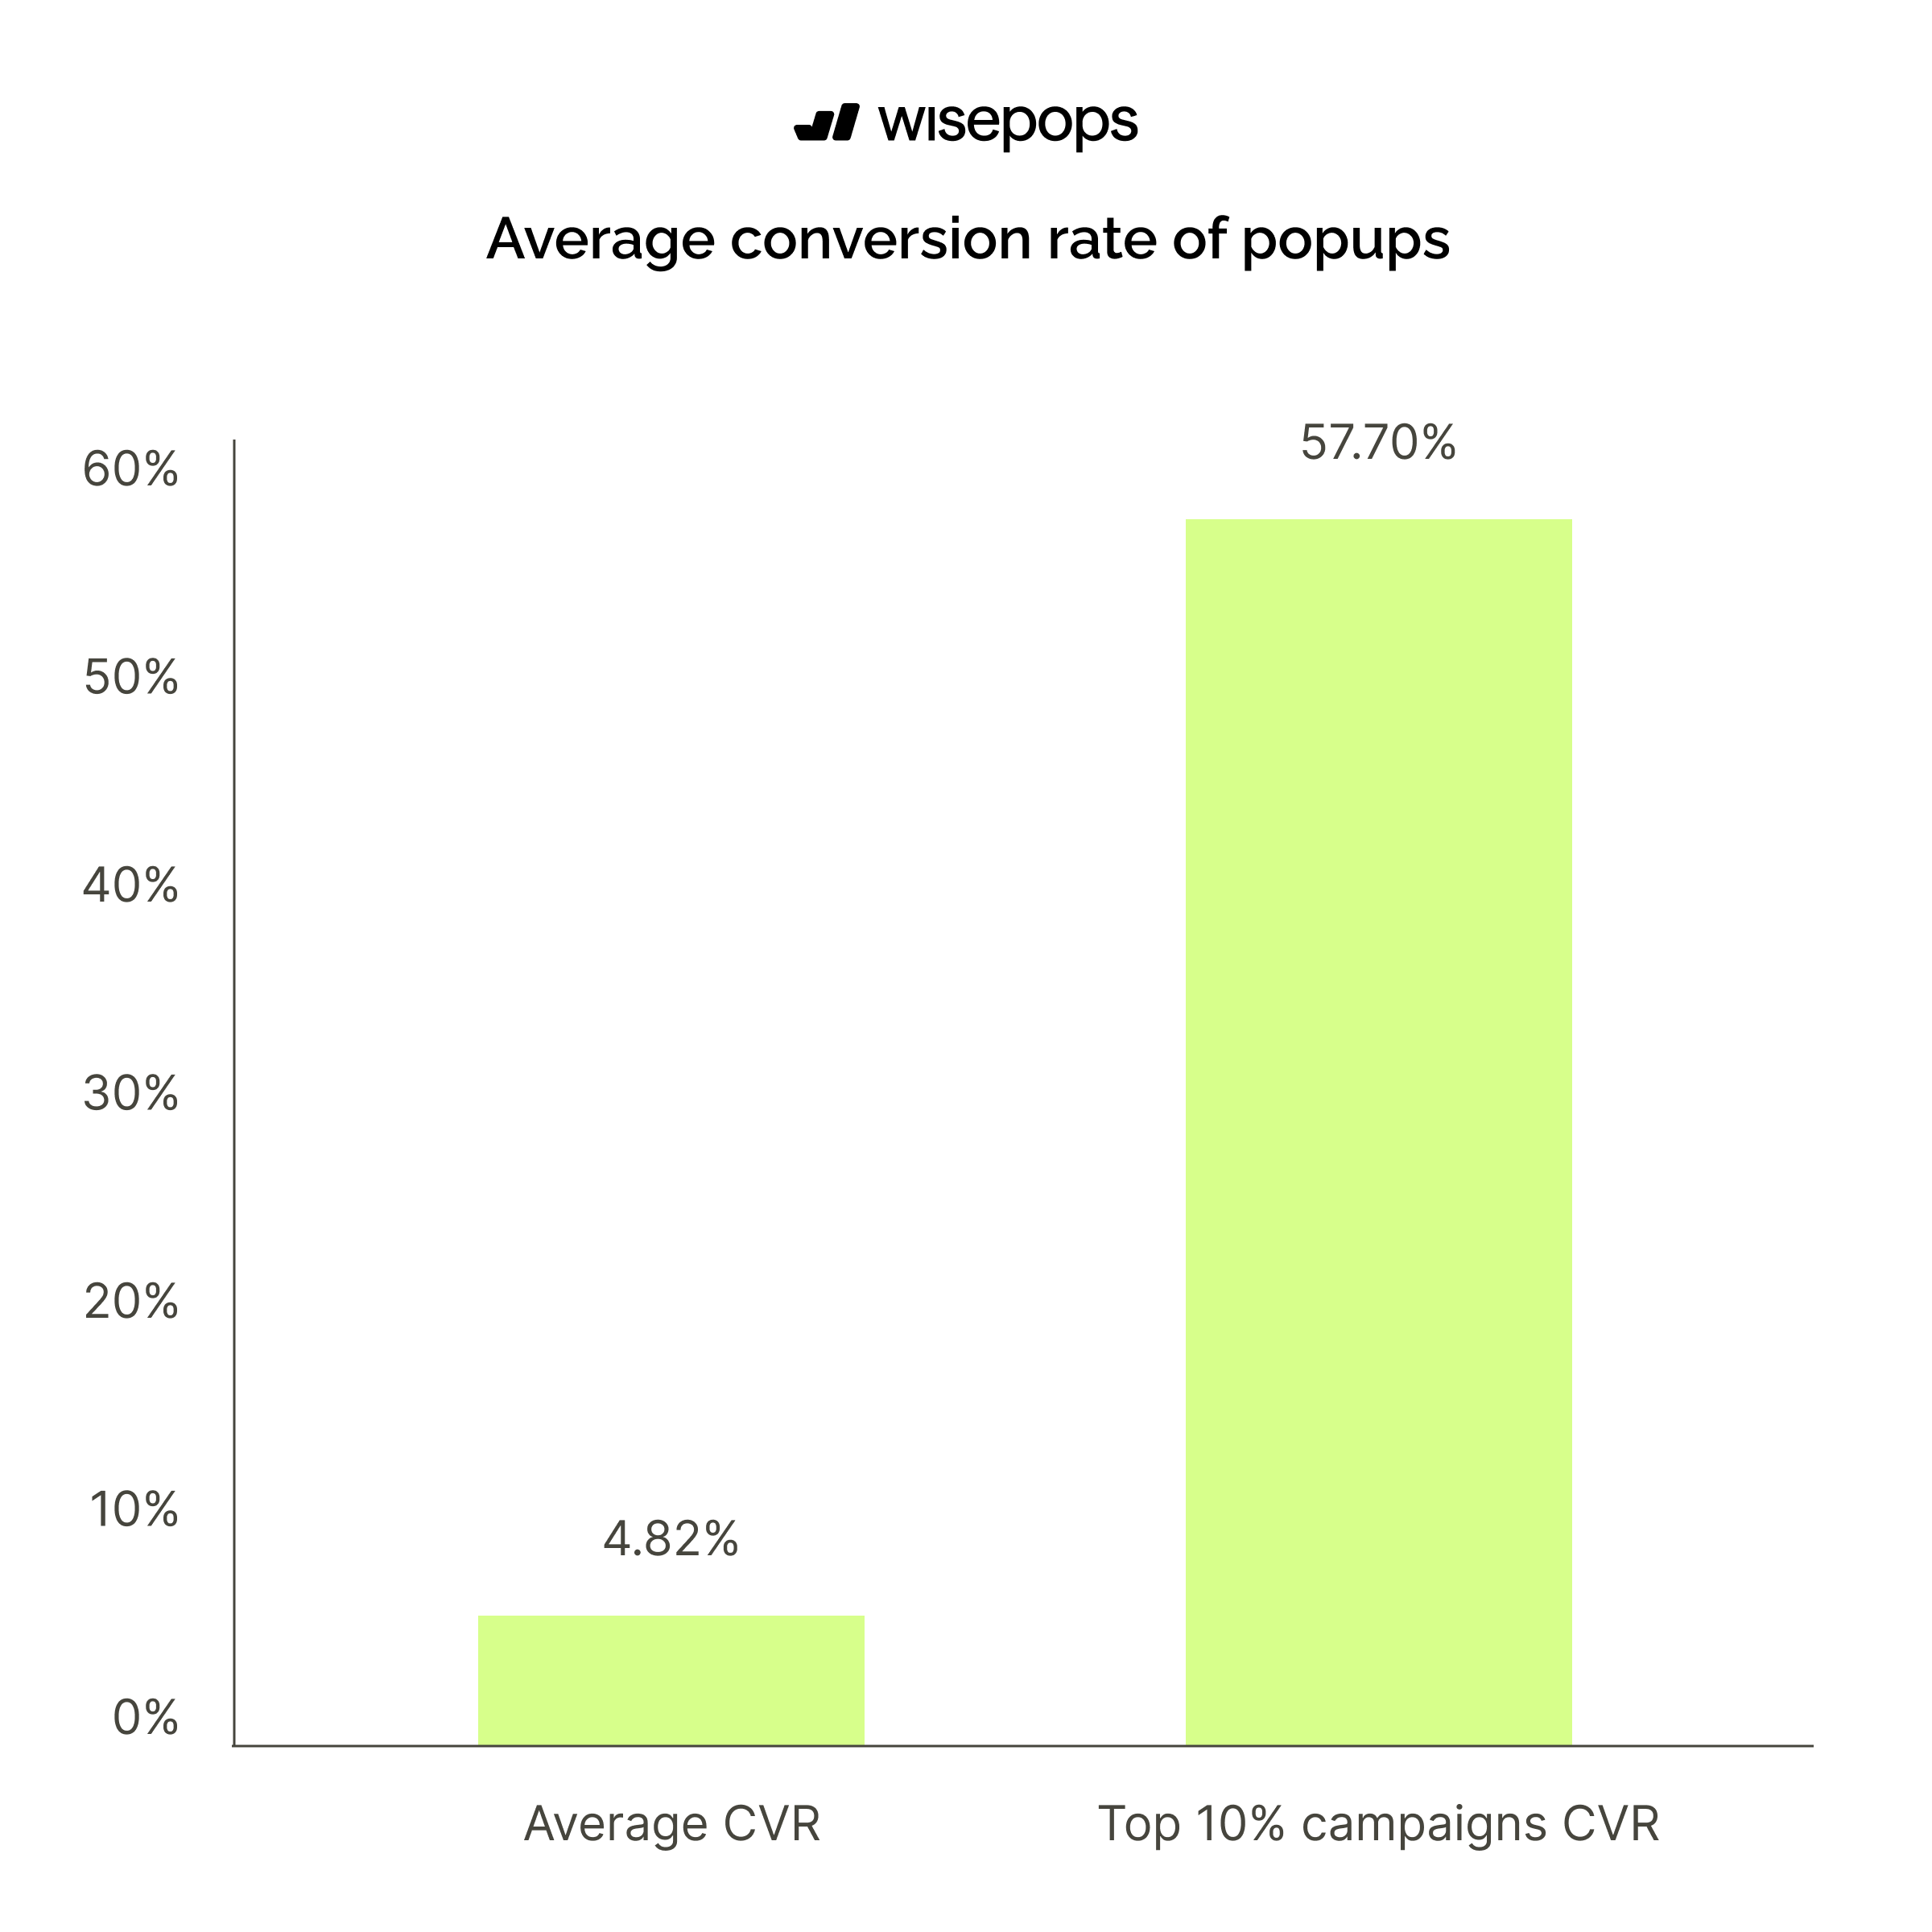
 CR of the best performers
The top-performing 10% of popup campaigns averaged a CVR of 57.7%. That’s five times higher than the average popup performance of the entire sample!
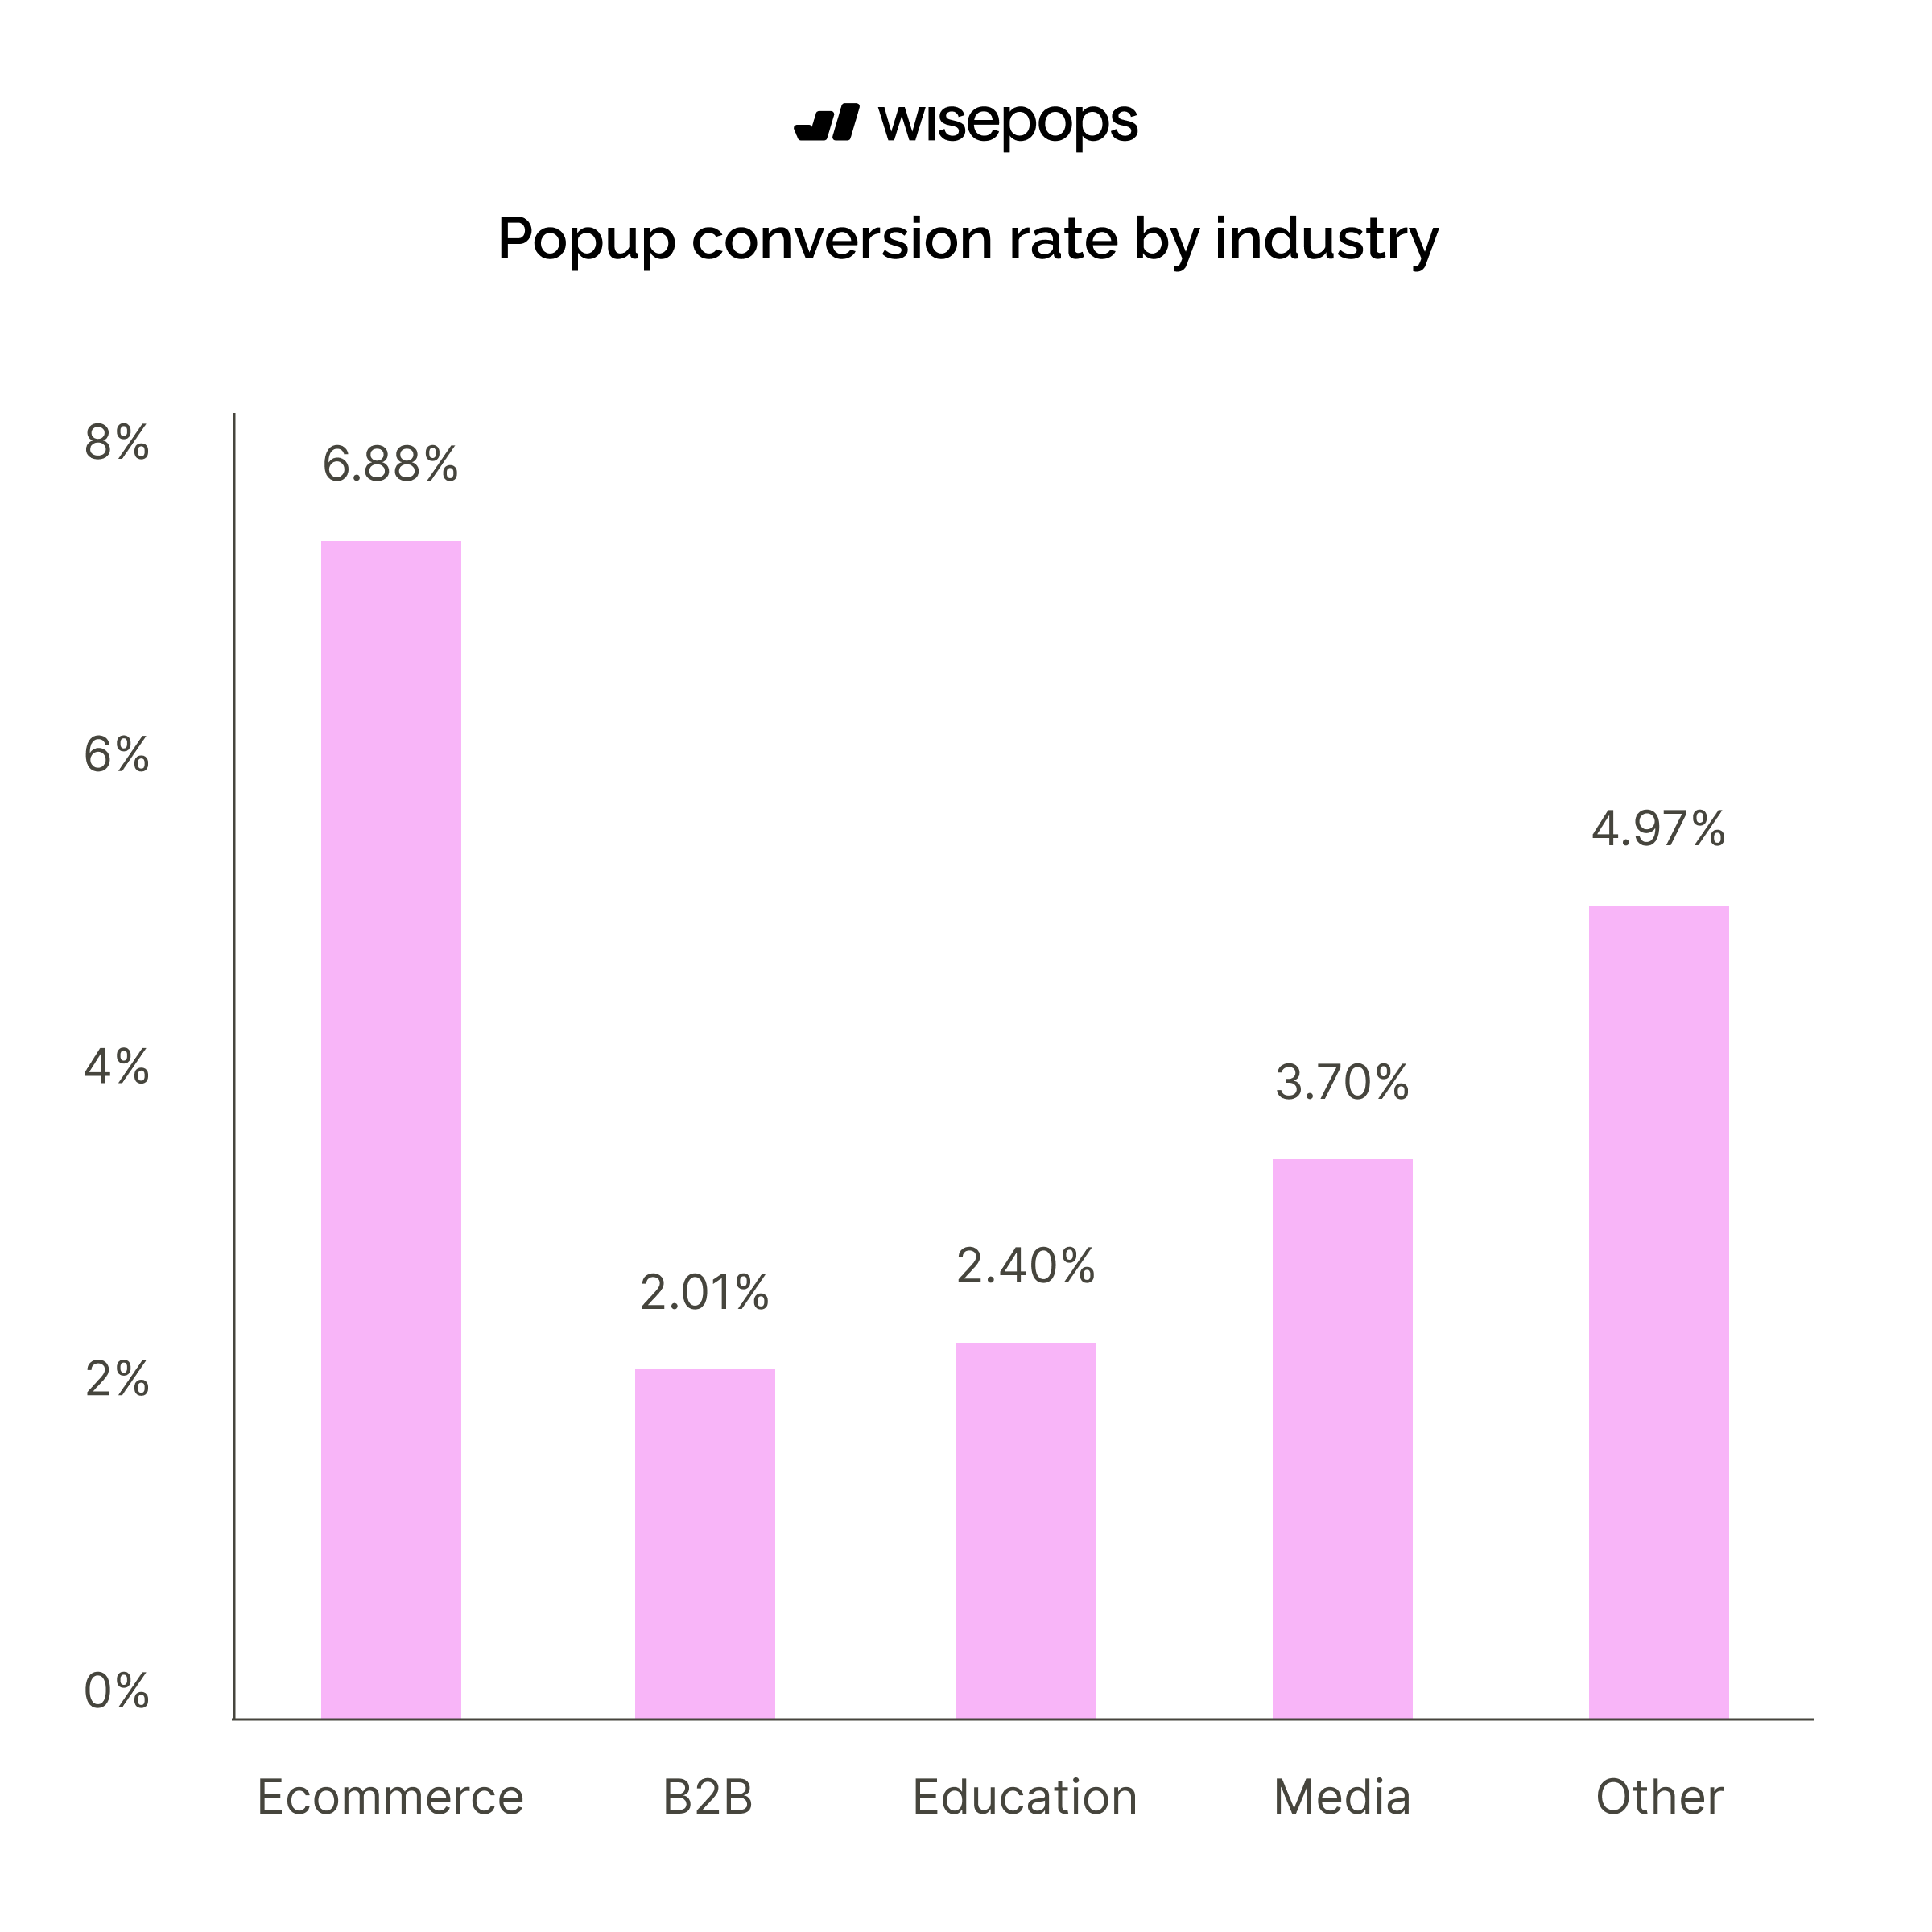
Which industries see the highest popup conversion rates?
Ecommerce businesses achieve the highest popup conversion rate at 6.88%, followed by Media at 3.70%. Education (2.40%) and B2B (2.01%) industries show significantly lower conversion rates, with B2B having the lowest performance overall.
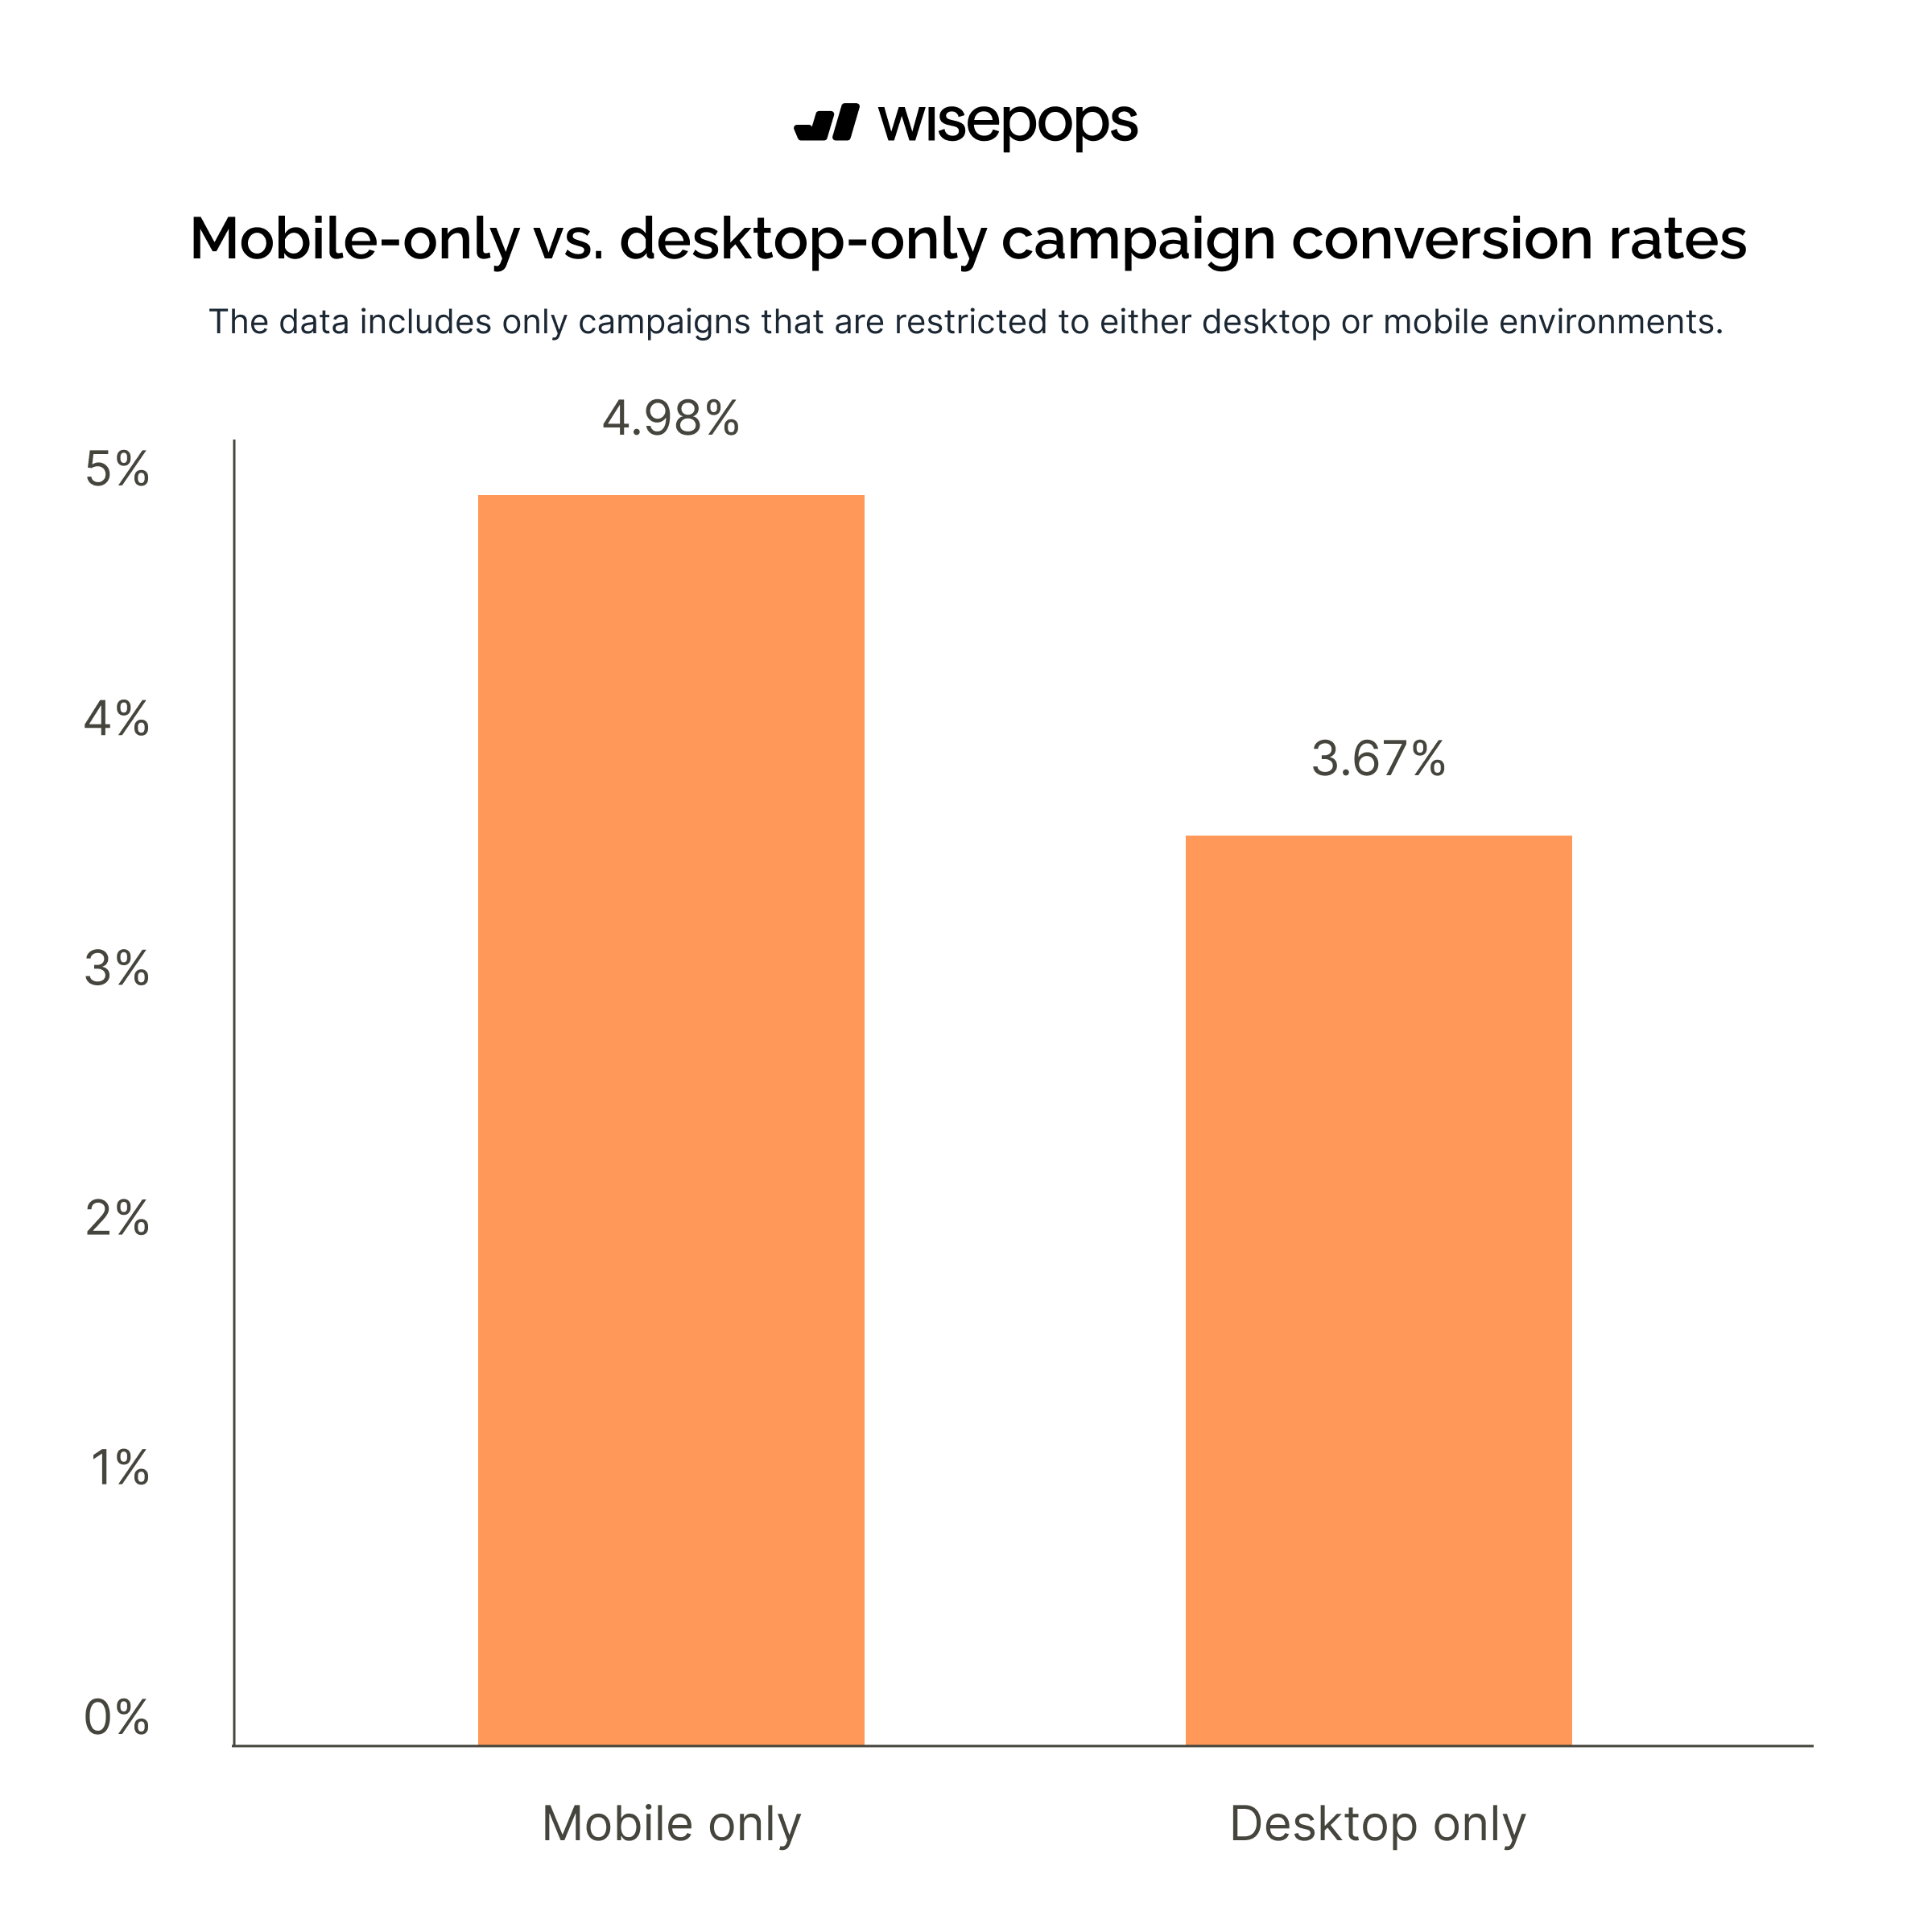
Mobile popup campaigns drive 36% more conversions in 2026 than desktop
Mobile popups convert at 4.98% compared to desktop popups at 3.67% in 2026, making mobile popups 36% more effective than their desktop counterparts.
These results confirm that mobile users can be more responsive to popup offers, reflecting the continued dominance of mobile browsing and shopping behavior, and demonstrate why businesses should prioritize mobile-optimized popup strategies to maximize conversions.
CR of the best performers
The top-performing 10% of mobile and desktop popup campaigns averaged a CVR of 59.19% and 52.56%, respectively.
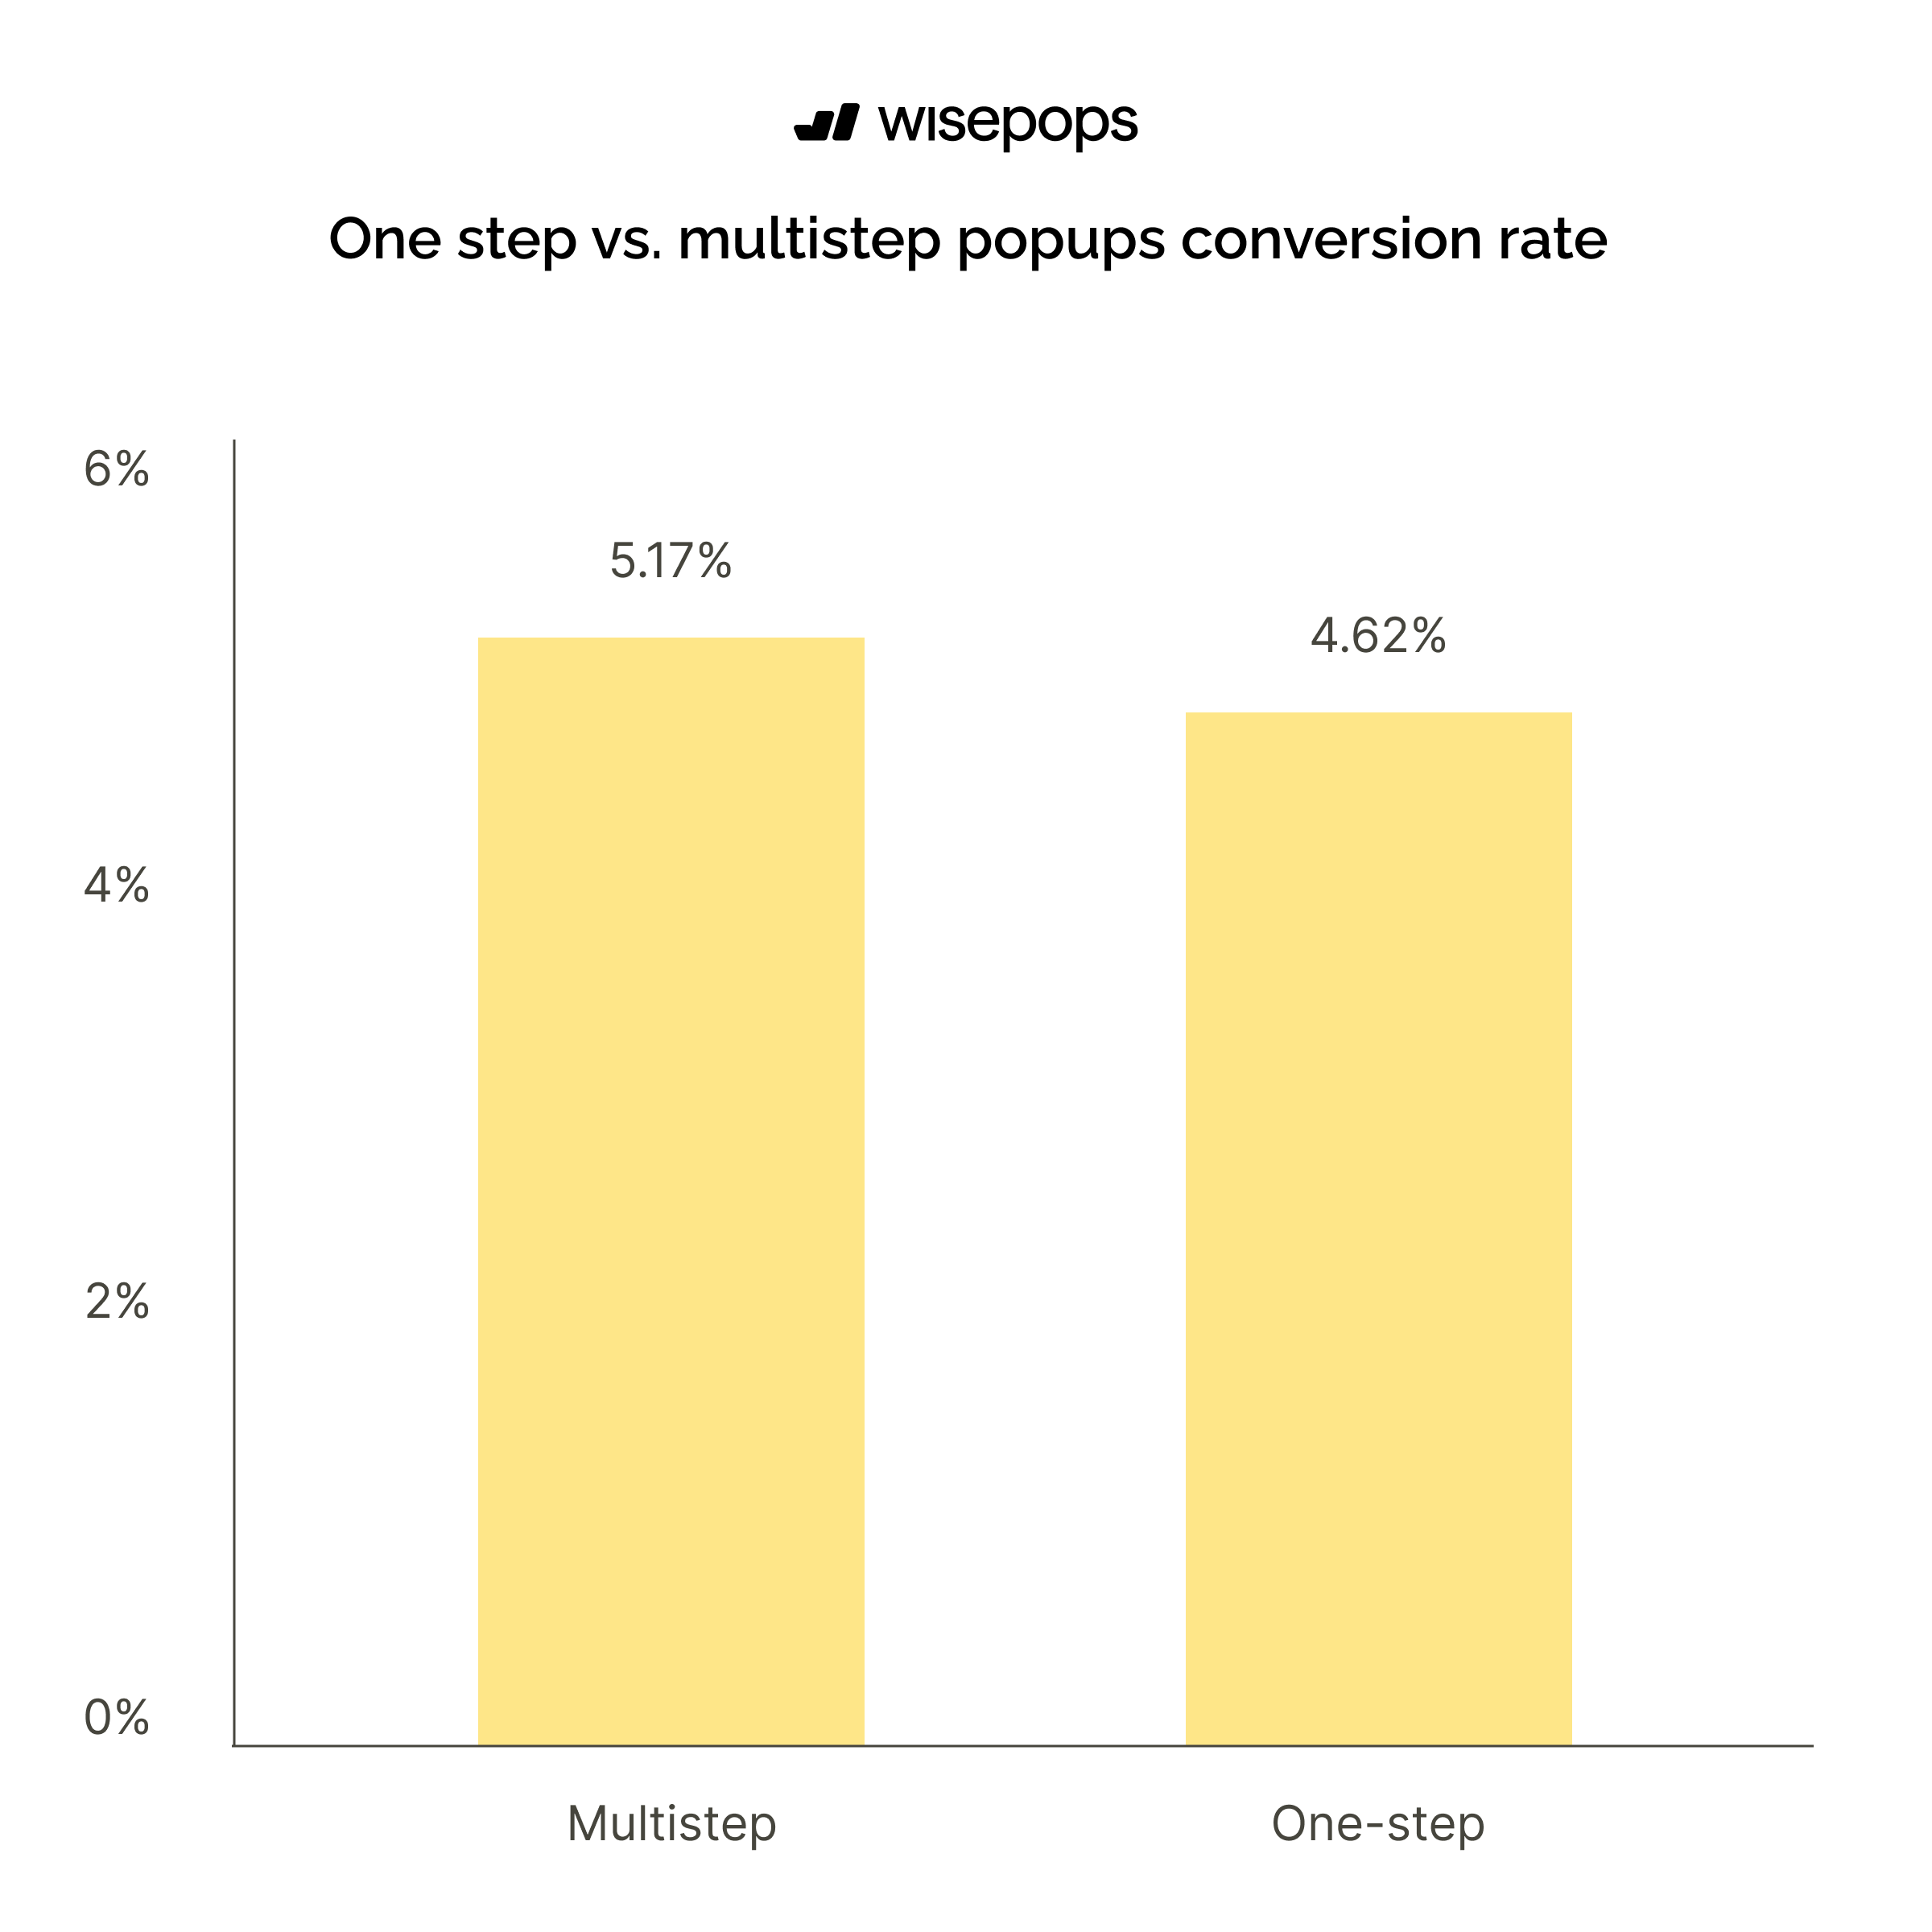
Multi-step popups convert better than single-step popups
Multi-step popups achieve a 5.17% conversion rate, which is 12% higher than single-step popups at 4.62%.
This data shows that adding an extra step to your popup campaigns can significantly improve engagement and conversions, as visitors perceive the progressive format as less overwhelming and more rewarding to complete compared to traditional single-step forms.
CVR of the best performers
The top 10% of multi-step popup campaigns achieve an impressive 46.34% conversion rate. This represents the highest-performing popup campaigns and demonstrates the significant potential of well-optimized multi-step popups.
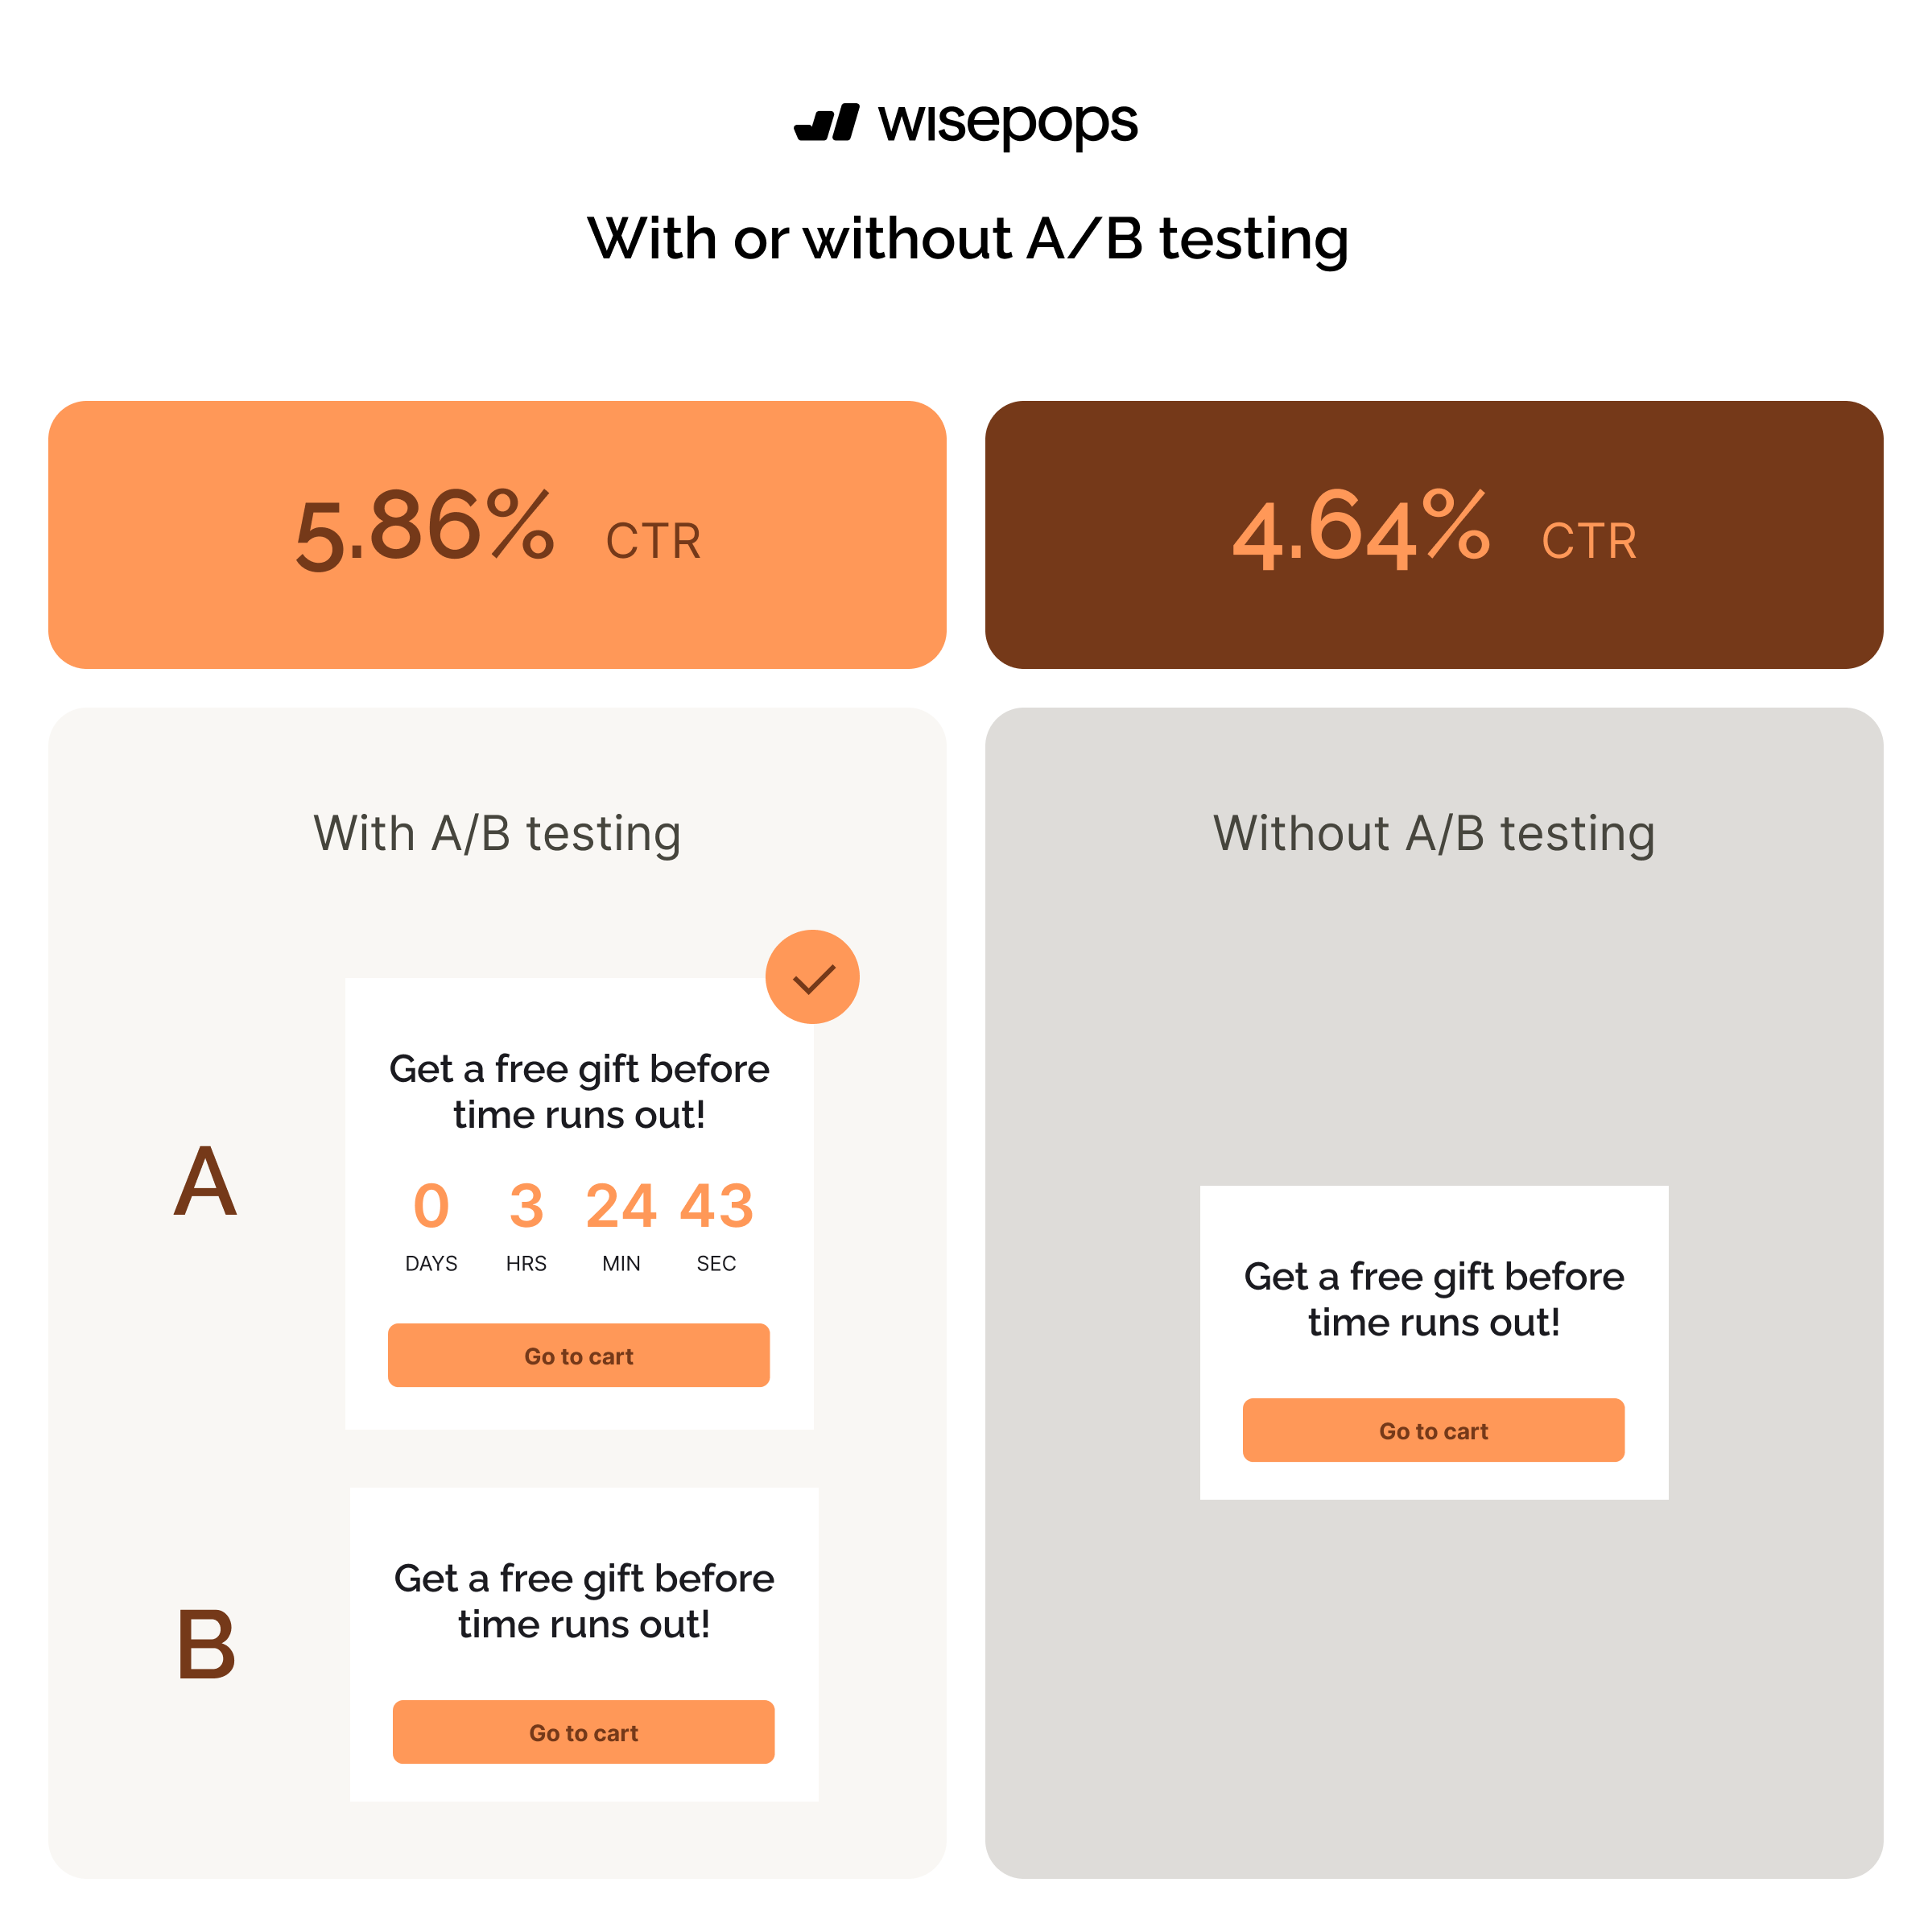
A/B testing popups is a way to increase clicks by up to 26%
A/B testing popups can increase click-through rates up to 26%, with experiments showing improvements from 4.64% to 5.86% CTR.
Changes such as adjusting the headline, display delay, format, the call-to-action (CTA), or testing different visuals can significantly impact how visitors interact with your popups, making A/B testing an essential strategy for maximizing conversions.
CR of the best performers
The top 10% of popups campaigns using A/B testing converted 26.83% of visitors on average in 2025.
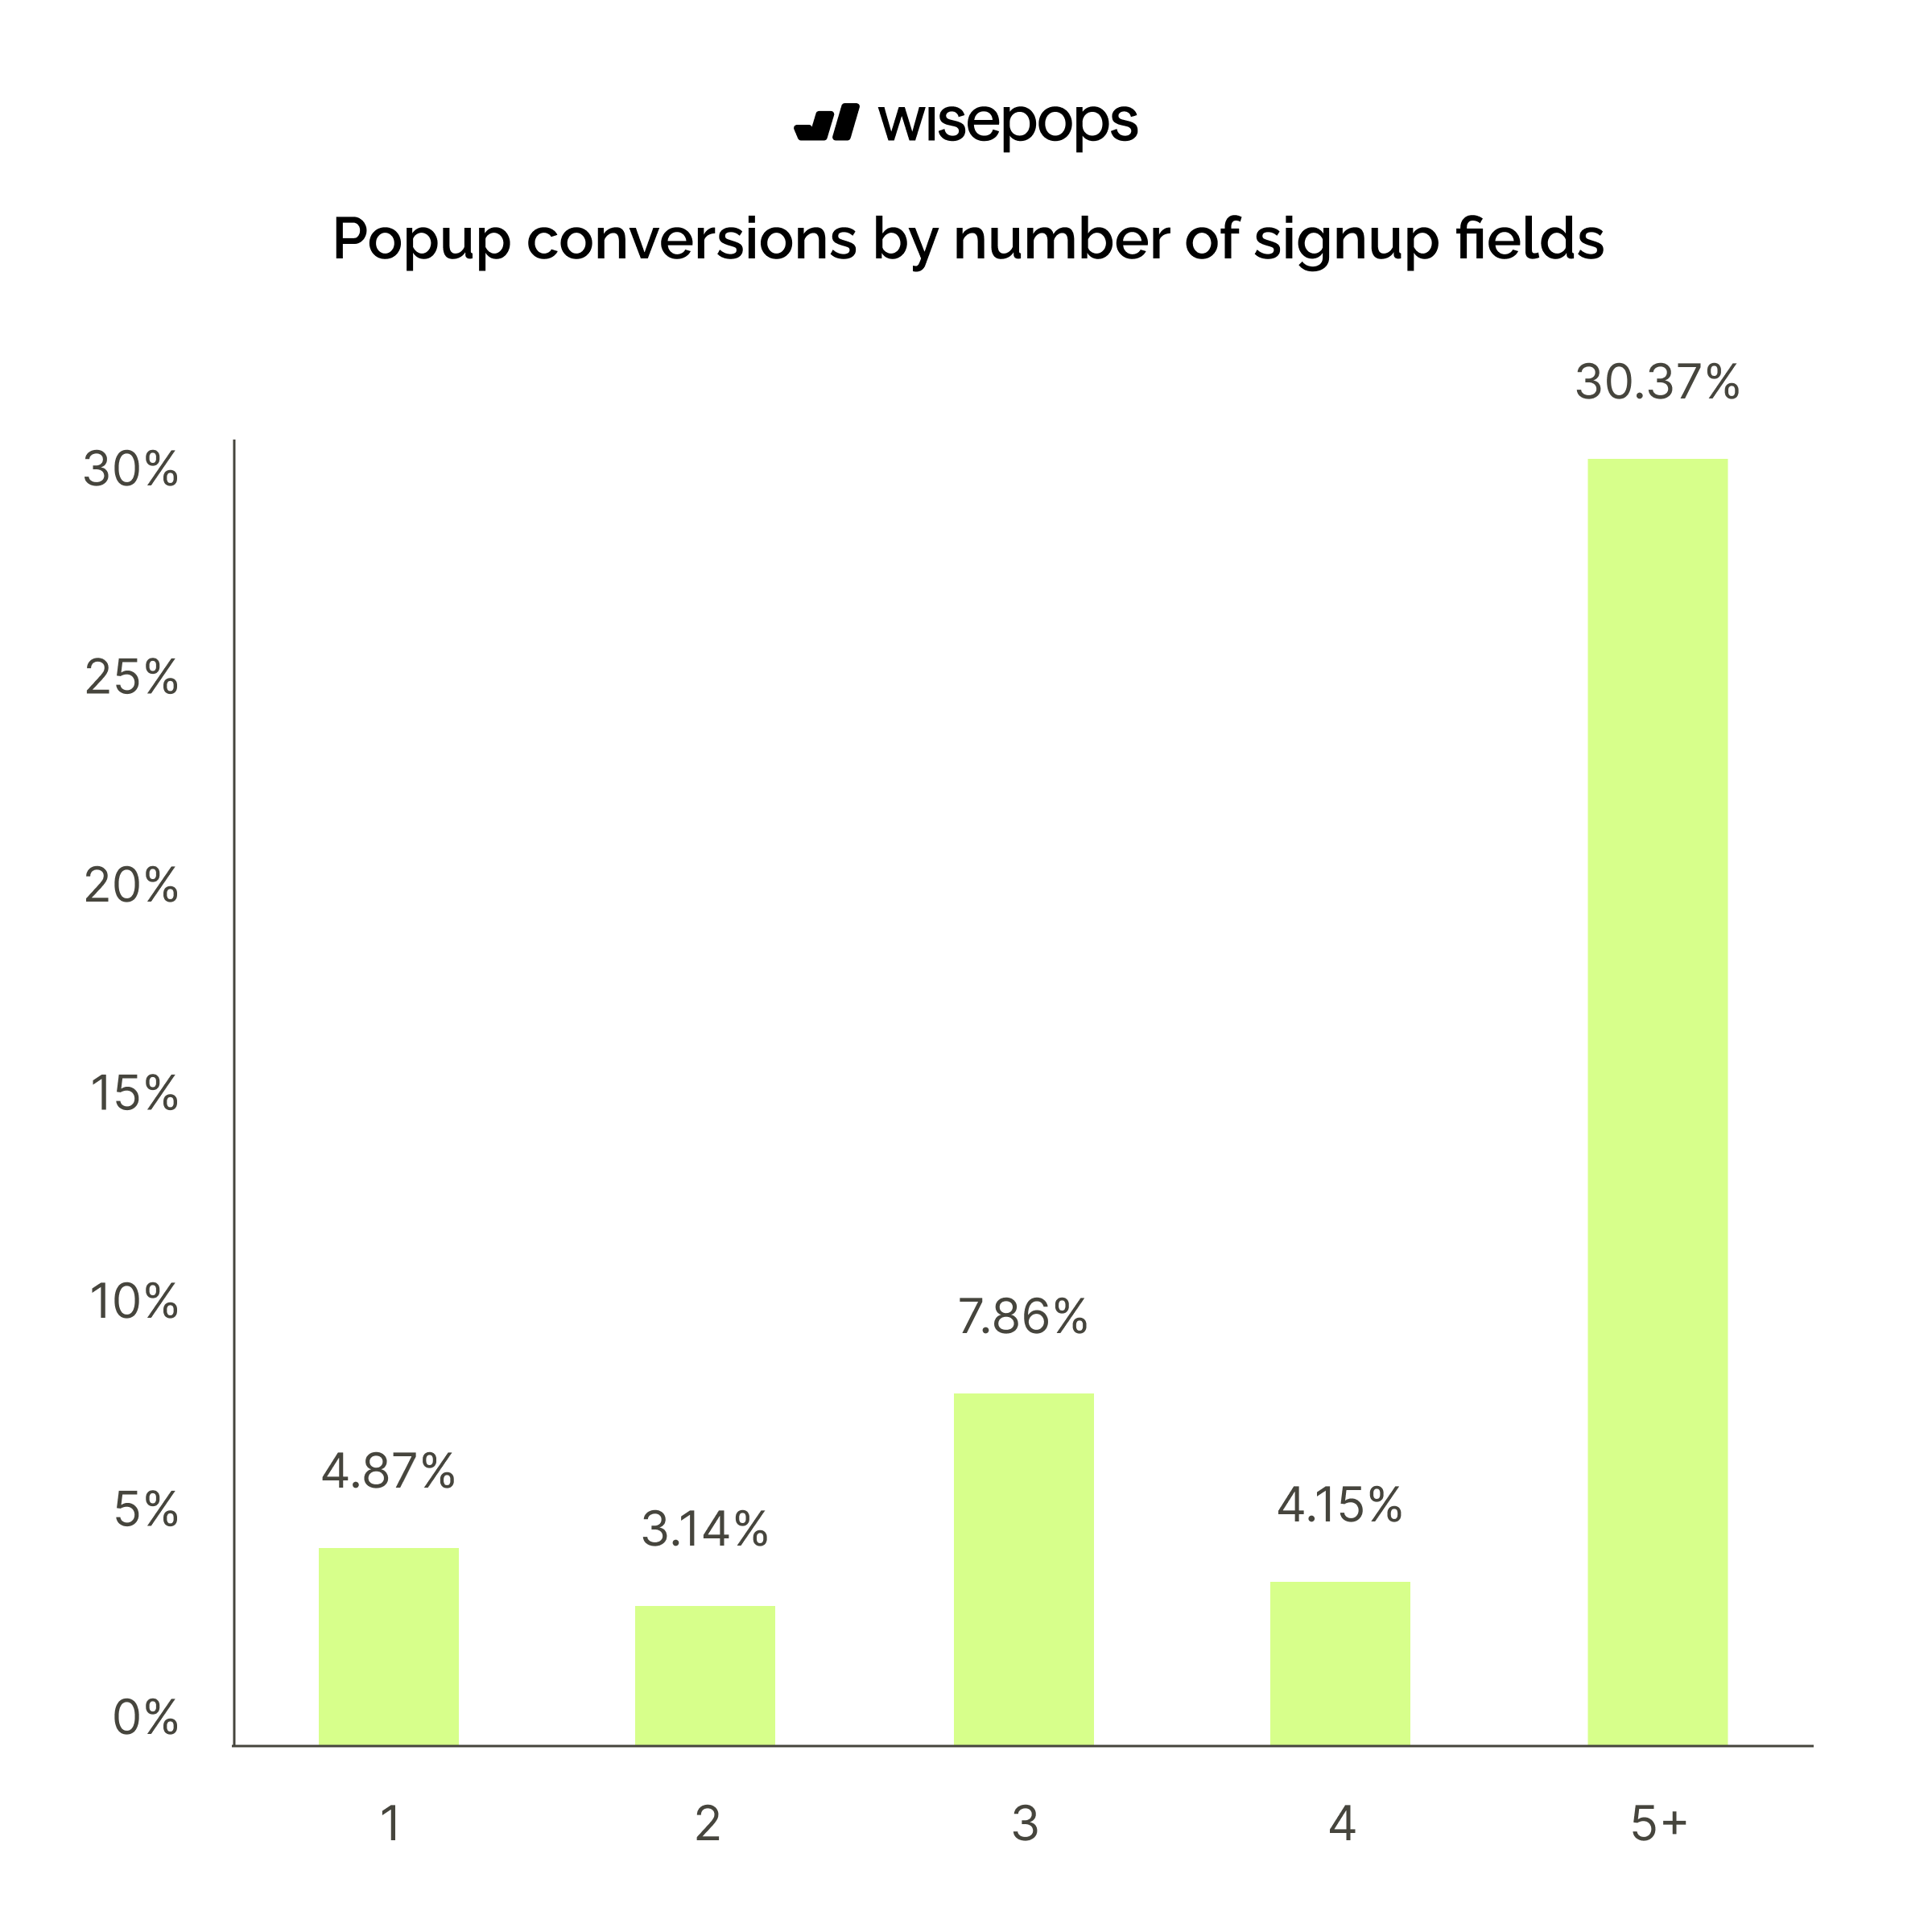
How many form fields should a popup have for best conversions?
Popups with 3 form fields achieve the highest conversion rate at 7.86%, representing a 62.7% improvement over the baseline. Single-field popups convert at 4.87%, while 2-field forms see a significant drop to 3.14% (-34.9%).
Interestingly, 5-field popups achieve an exceptional 30.37% conversion rate with a massive 528.7% increase, though this likely applies to highly qualified traffic or specific use cases. The data suggests that finding the optimal number of fields depends on your audience and offer.
The top 10% of campaigns CVR by number of signup fields:
One field: 48.21%
Two fields: 49.02%
Three fields: 72.83%
Four fields: 69.74%
Five fields: 55.37%
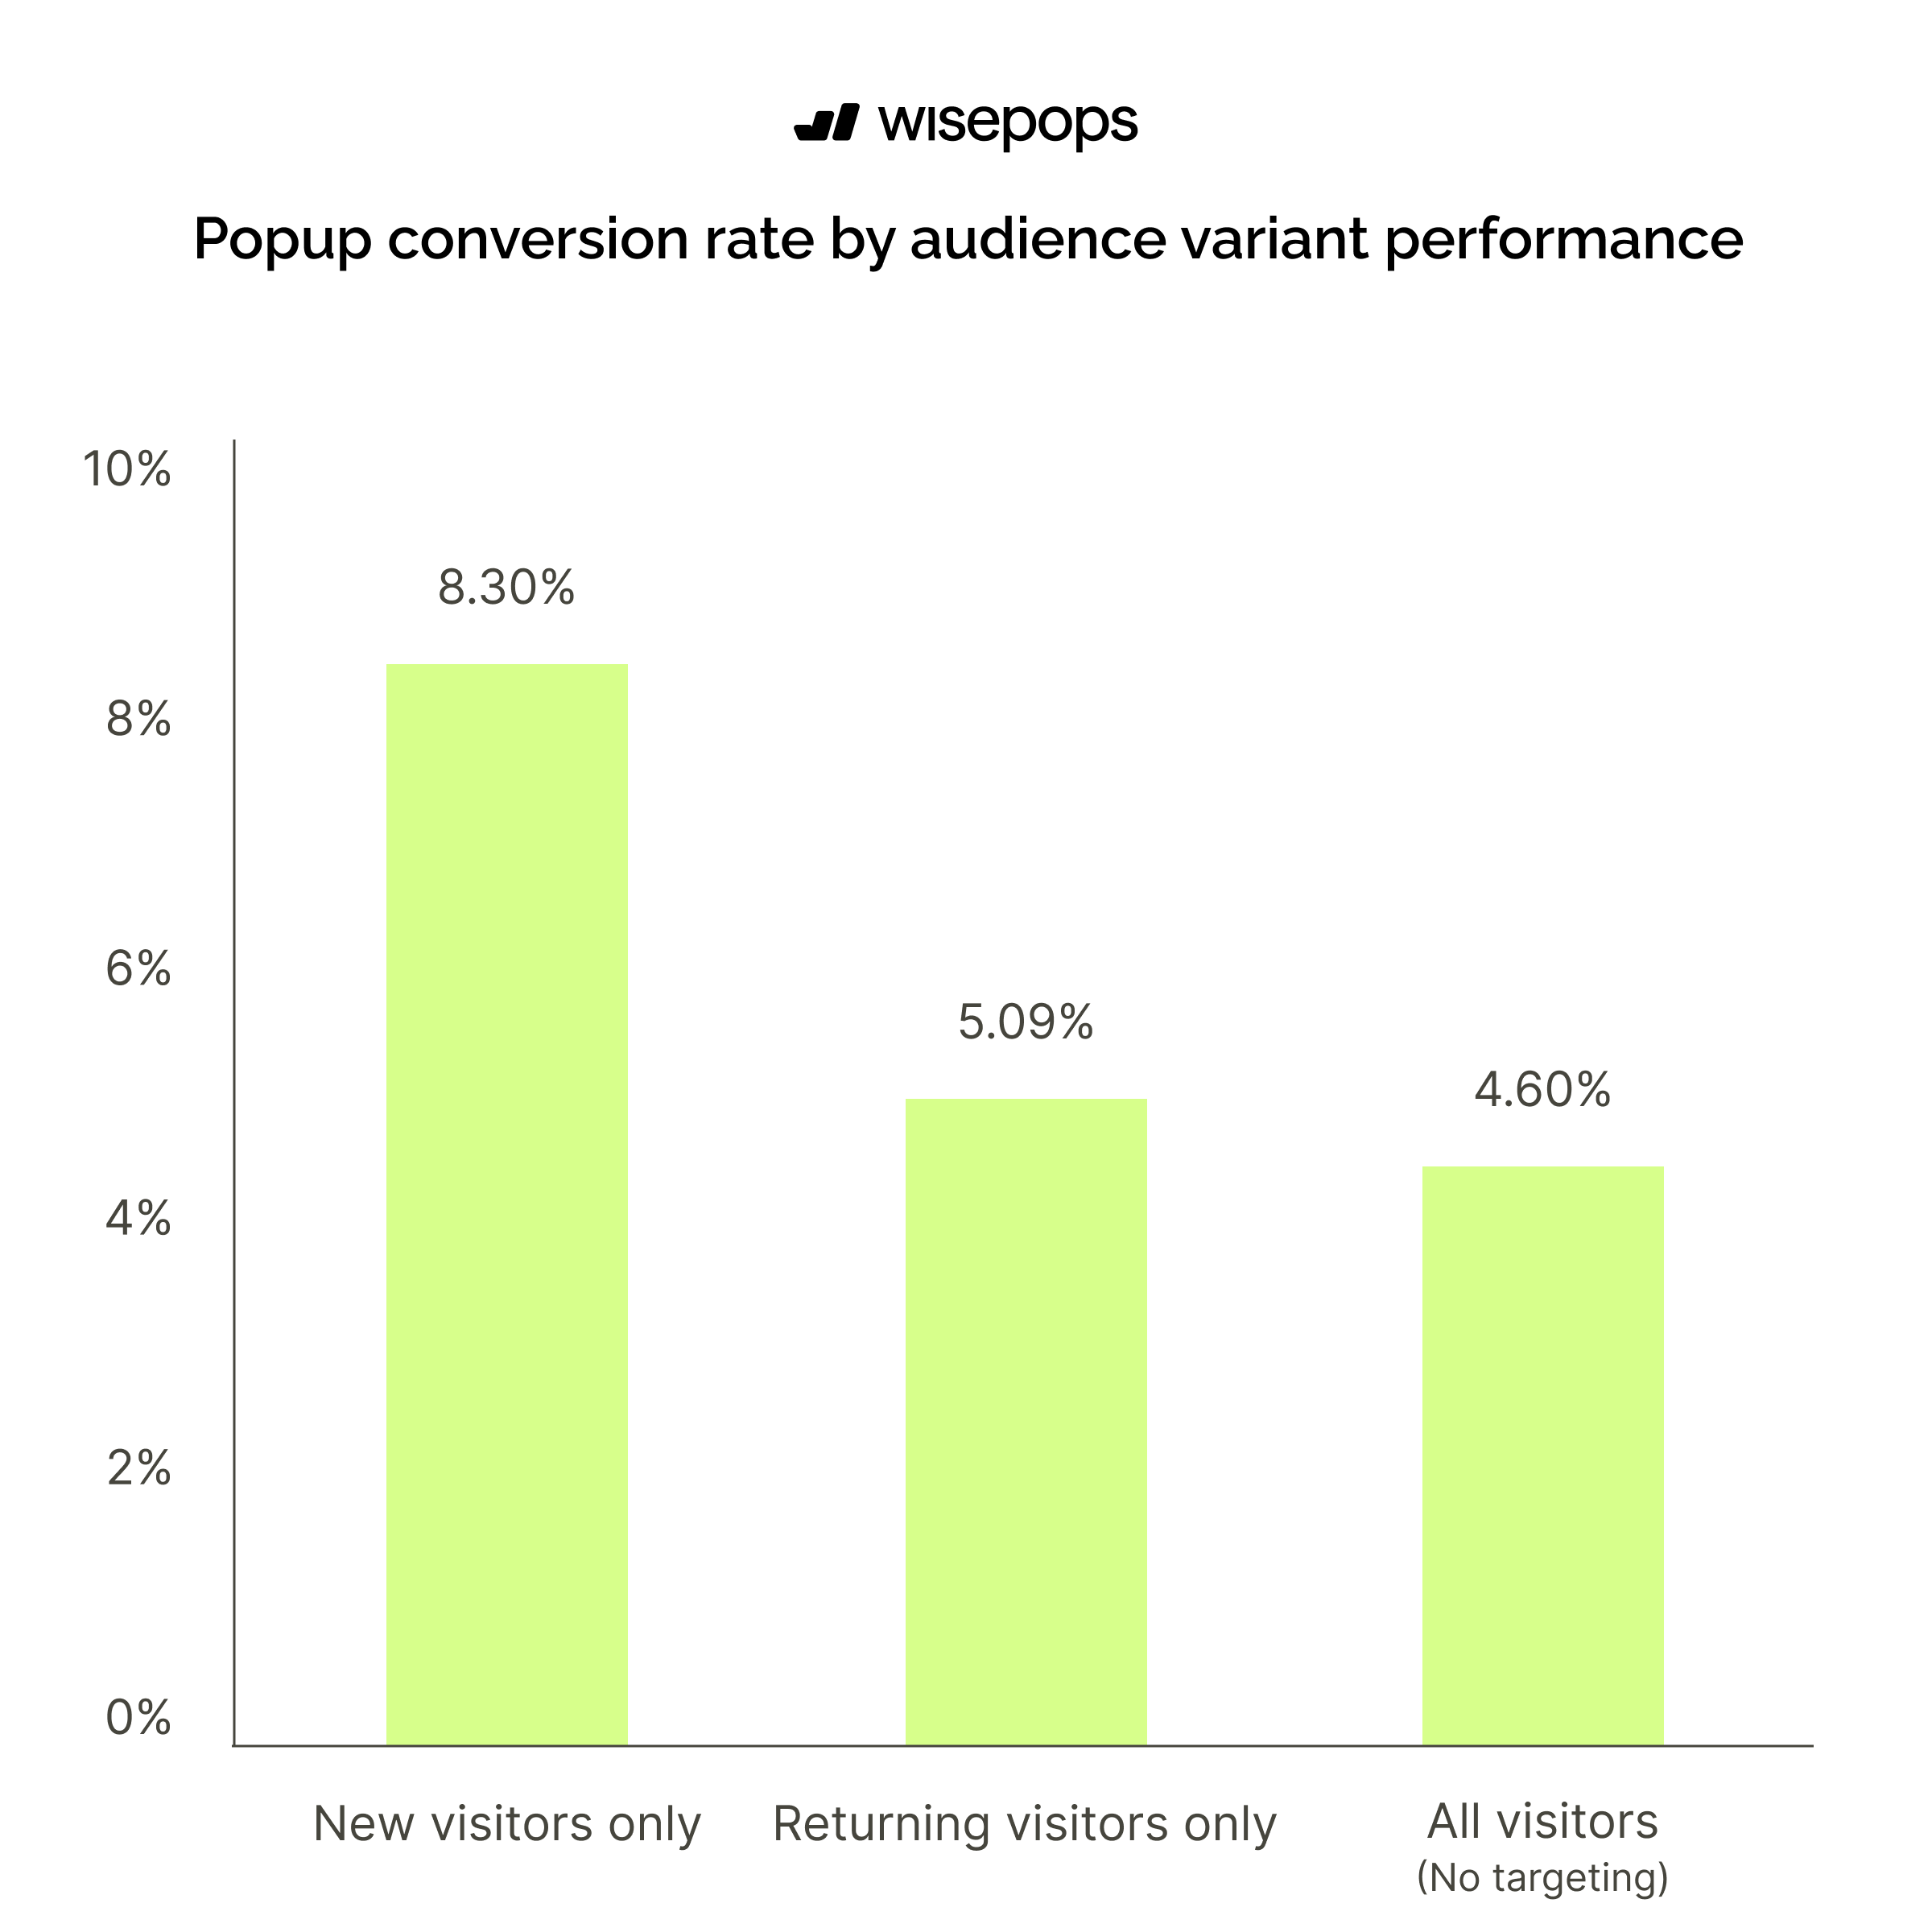
New visitor popups achieve the highest conversion rates across audience segments
Popups targeting new visitors only achieve an 8.30% conversion rate, while returning visitor campaigns convert at 5.09% and untargeted popups shown to all visitors convert at 4.60%.
This data shows that new visitors are particularly receptive to introductory offers, welcome discounts, etc., making new visitor targeting an effective strategy, though all approaches deliver good results depending on business goals and customer journey optimization needs.
The top 10% of campaigns CVR by audience targeting:
New visitors only: 22.88%
Returning visitors only:
All Visitors (no targeting): 60.09%
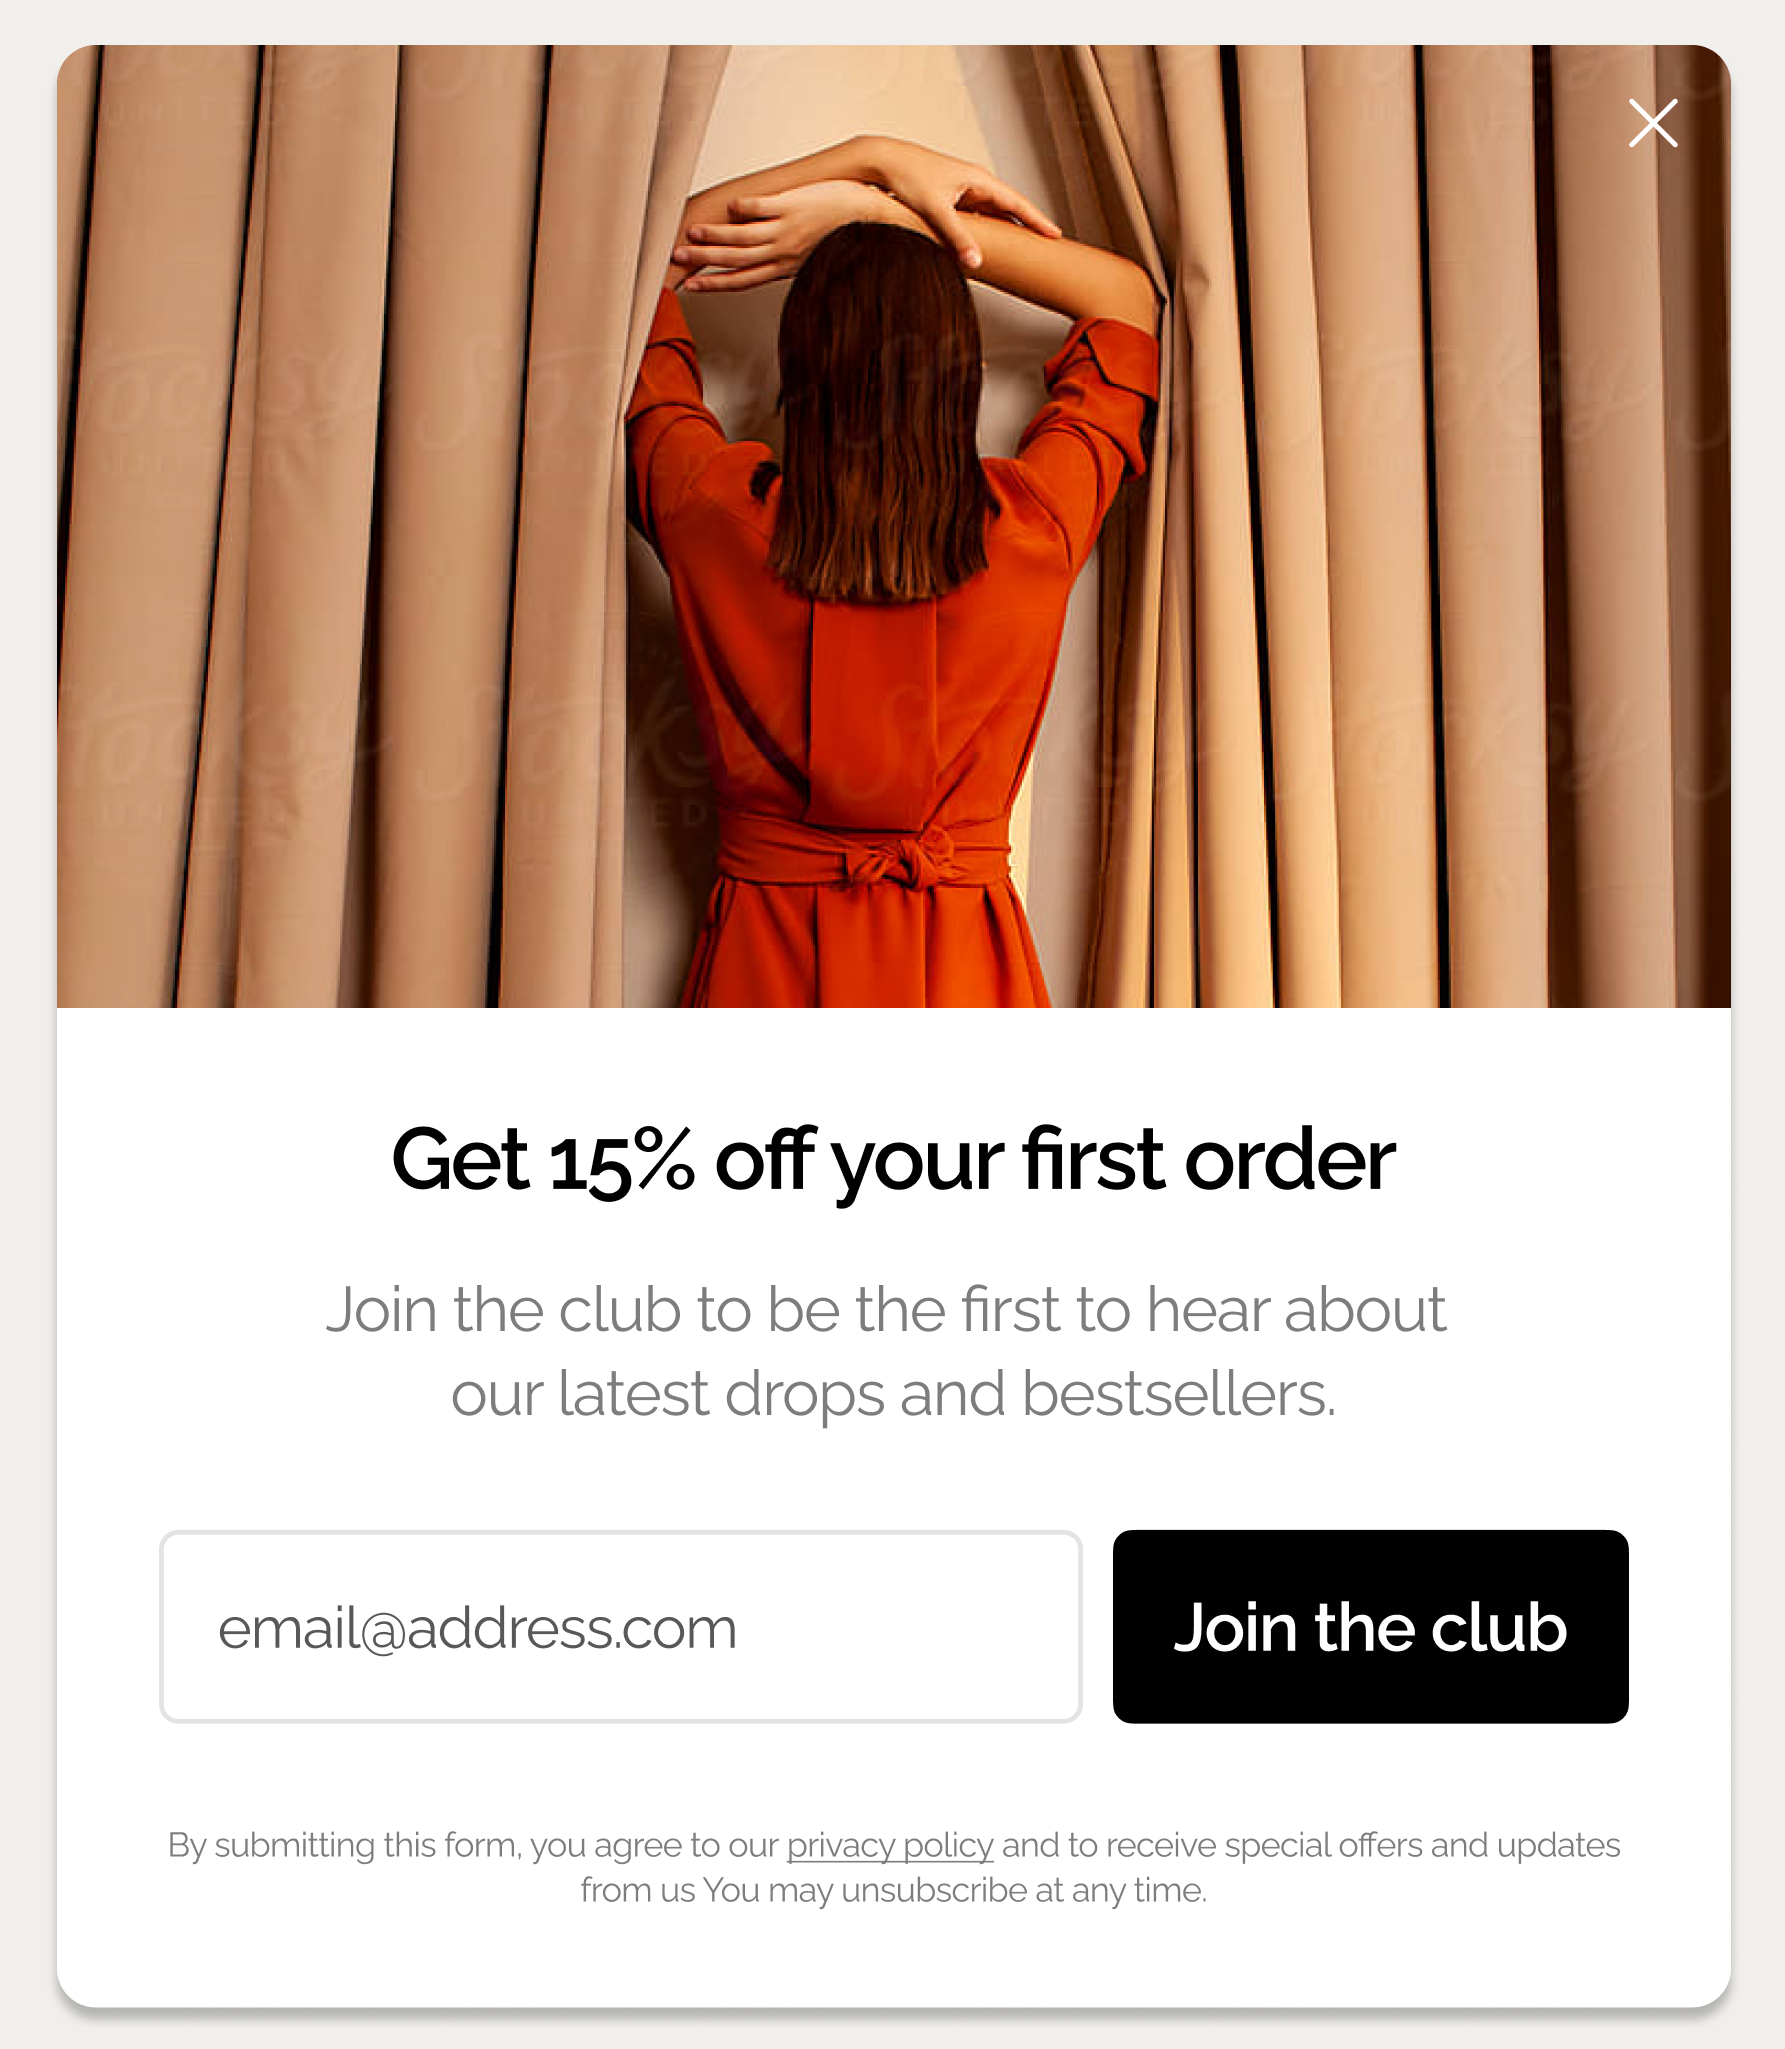
Popups with images convert better
Popups with images achieve a 5.71% conversion rate, significantly outperforming popups without images at 3.98%.
This 43% performance advantage demonstrates that visual elements play a crucial role in capturing attention and driving engagement, making images an essential component of high-converting popup campaigns.
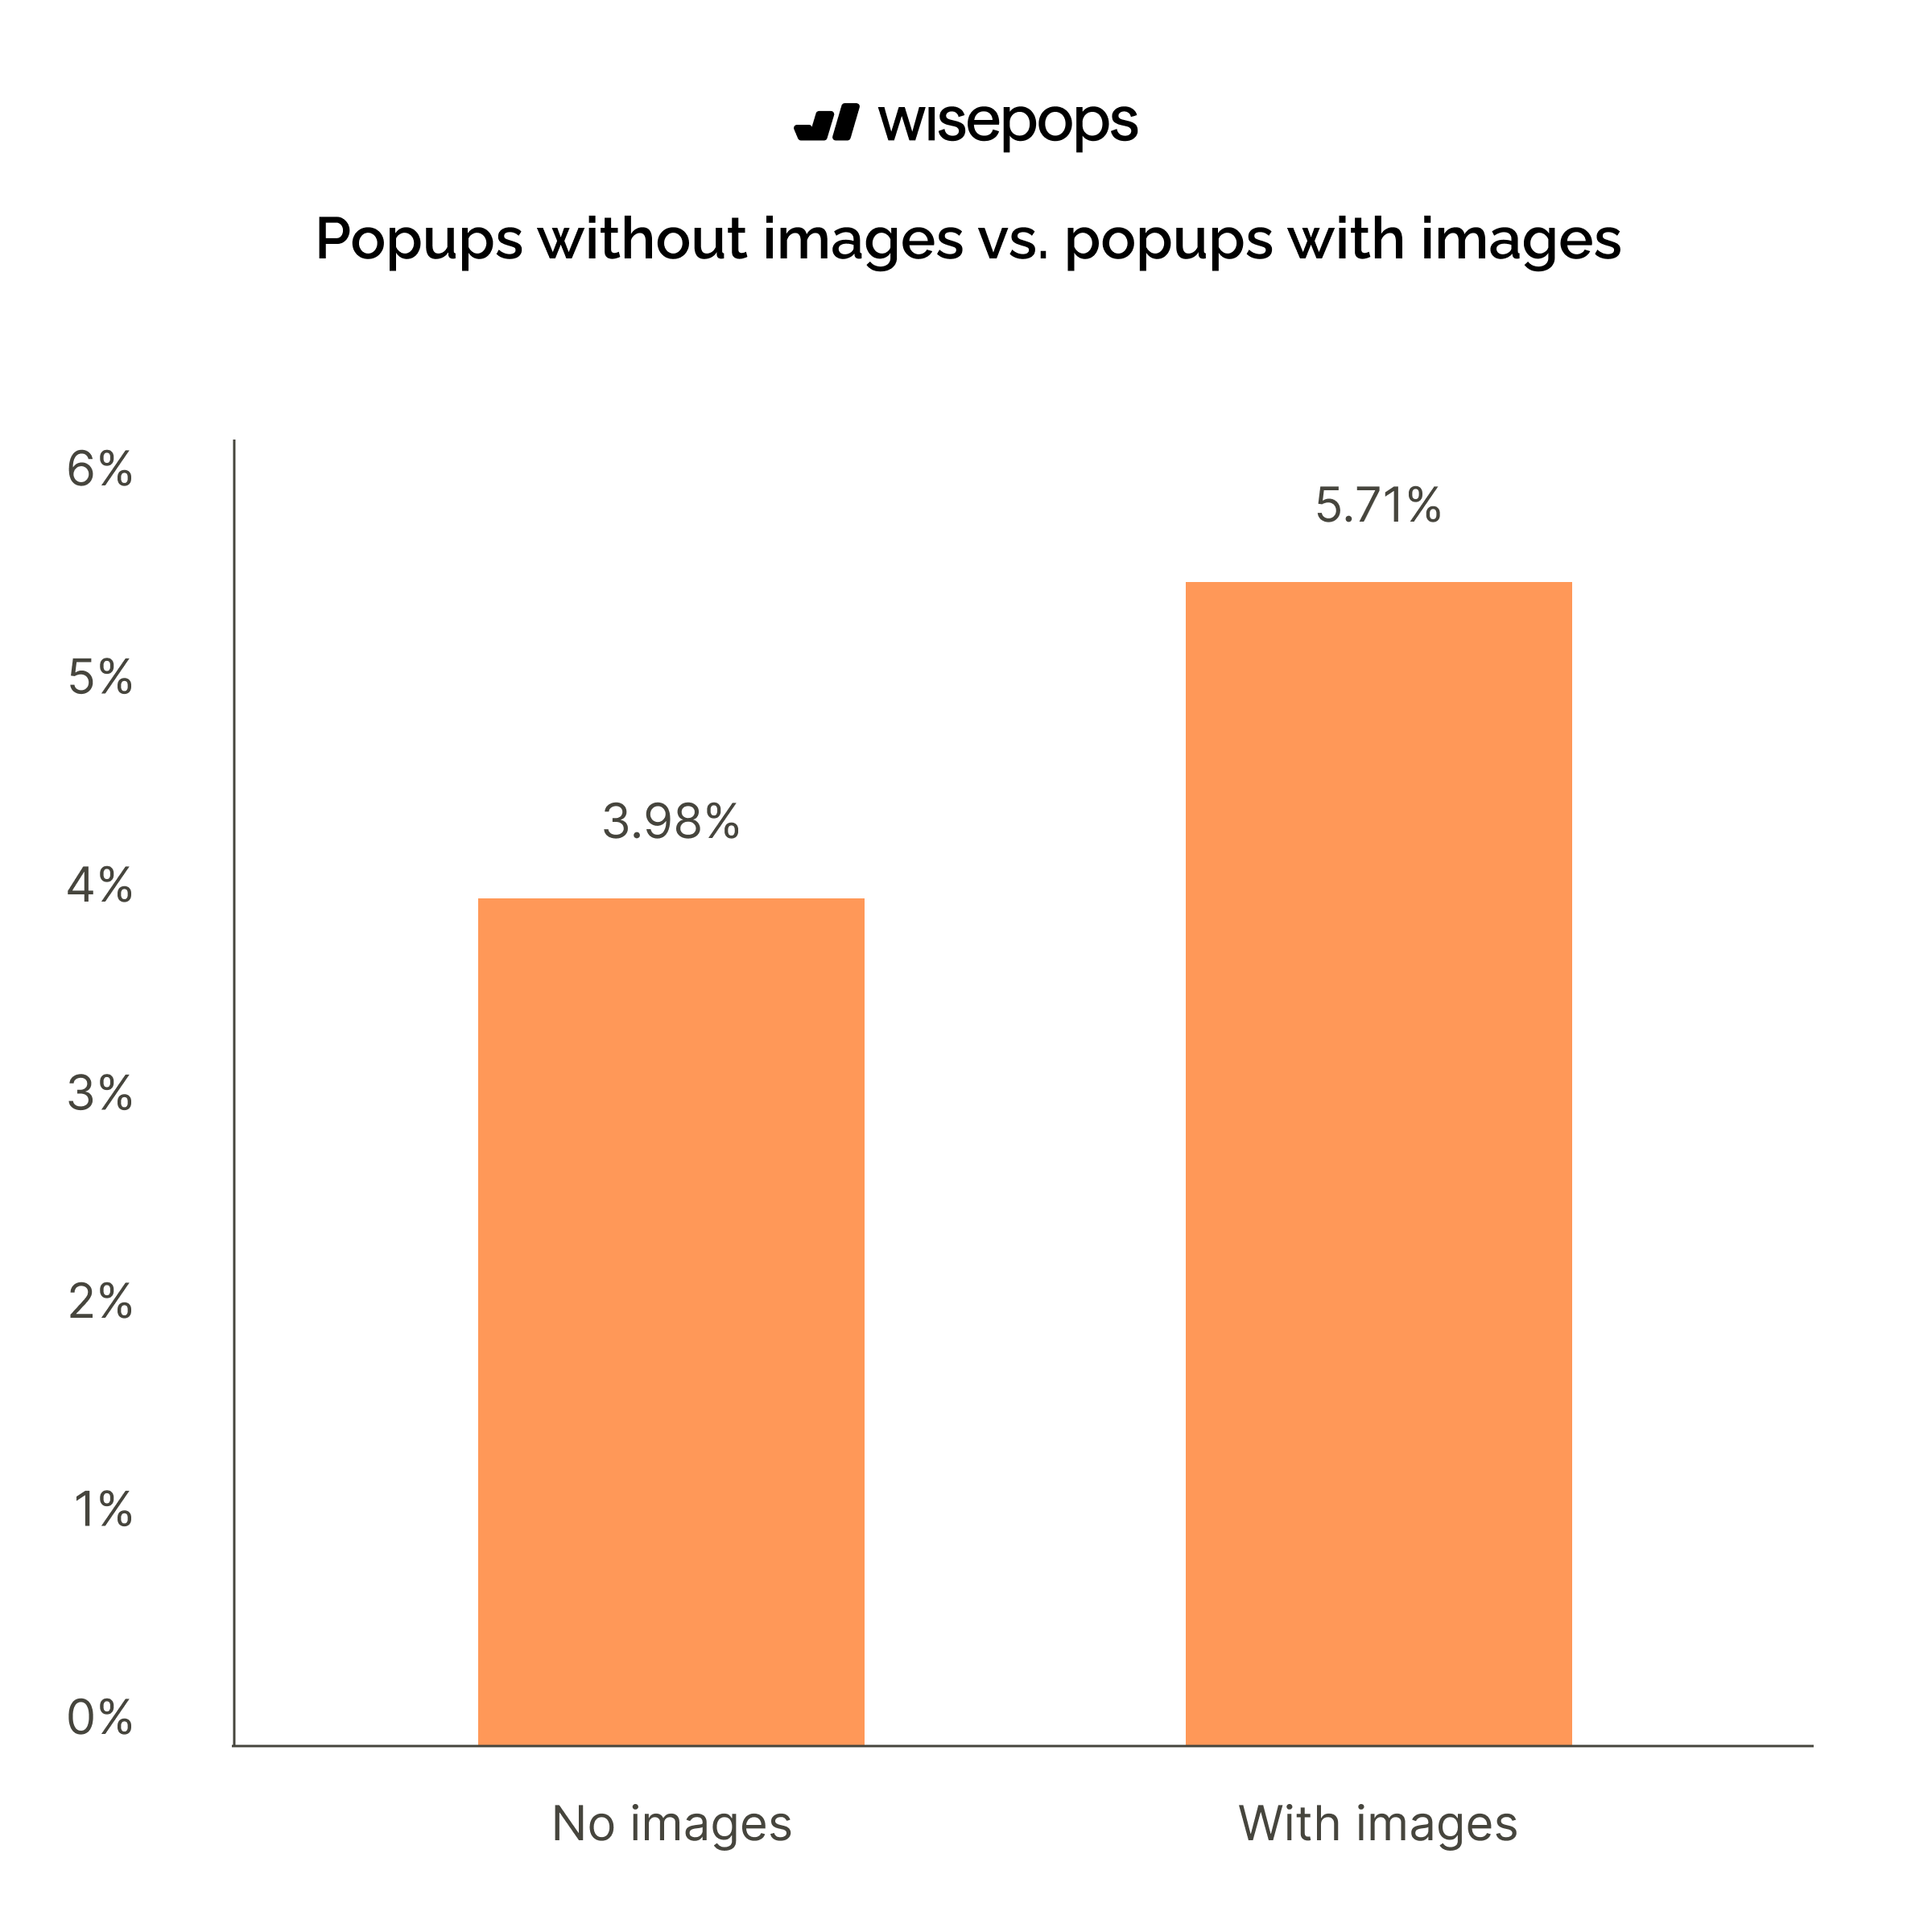
So, using images in popups is an effective way to boost a website's conversion rate. A good-looking image can reinforce popup copy, convey more information, and support your brand image.
🏆 The top 10% campaigns
The 10% of top-performing popup campaigns with images converted 55.69% of visitors on average.
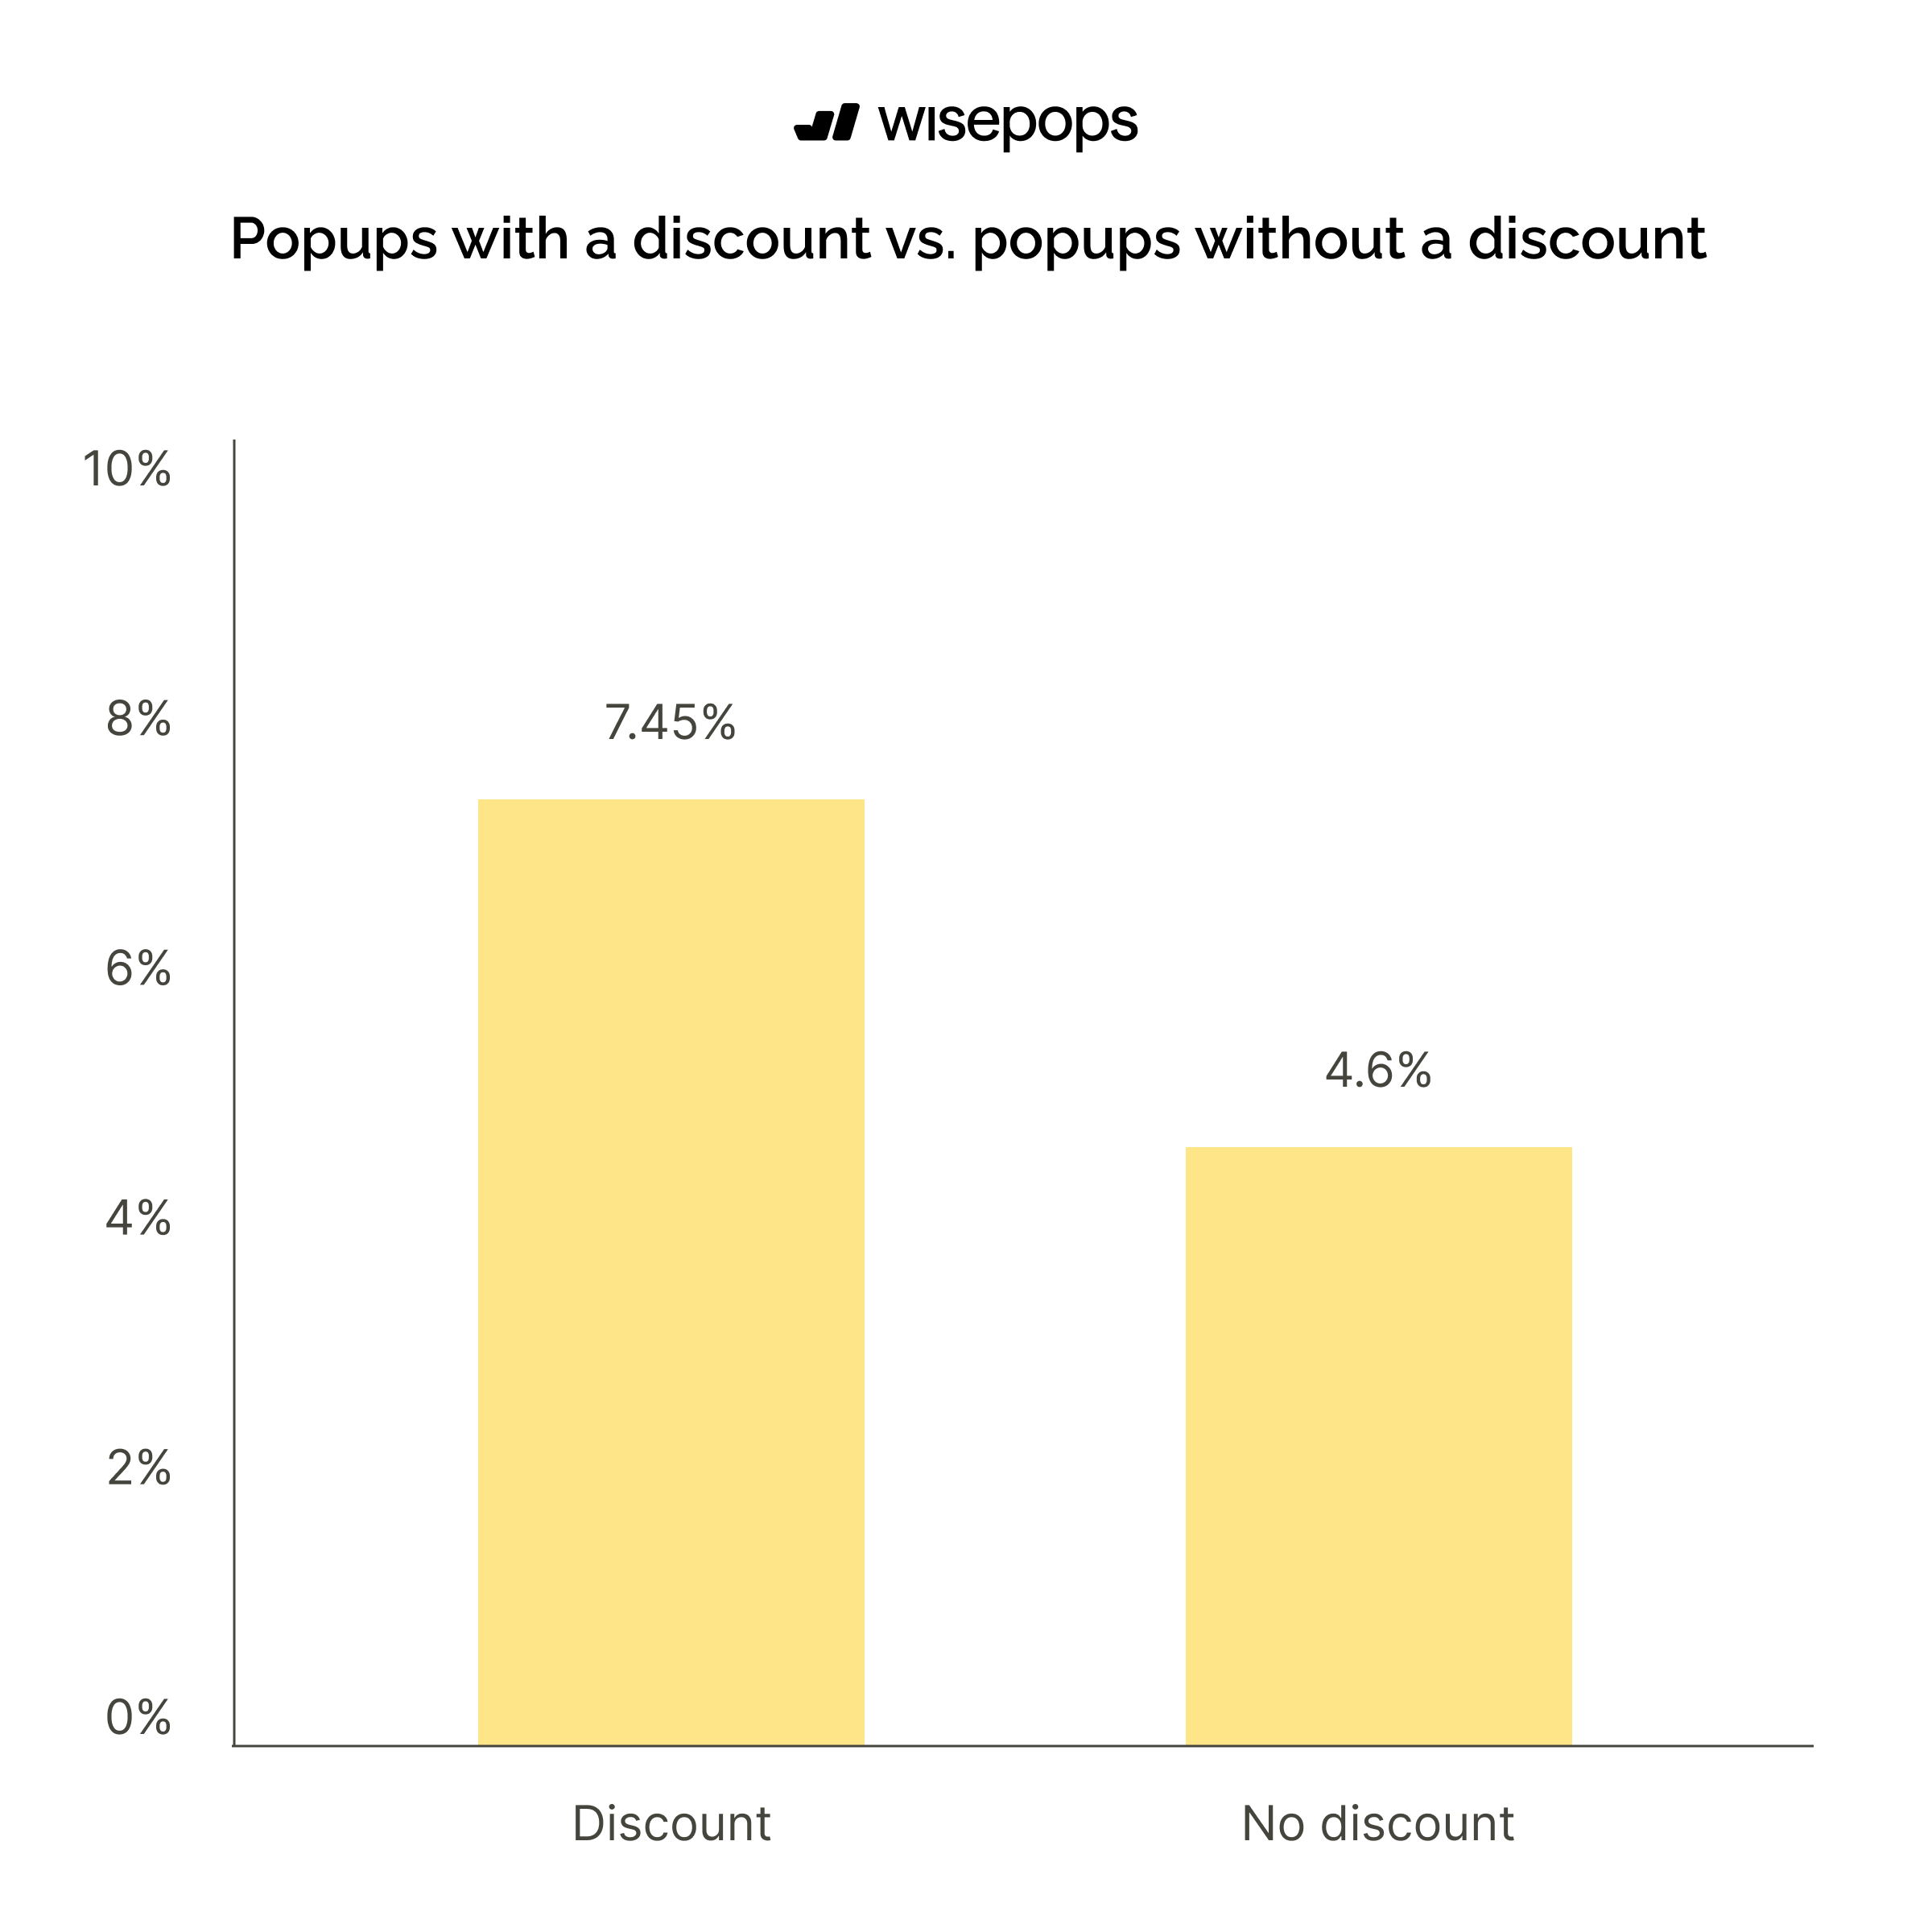
Discount popups convert better than regular popups
Popups offering discounts achieve a 7.45% conversion rate, which is 62% higher than popups without discounts at 4.60%.
This makes discounts the most effective signup incentive in popup campaigns, as the immediate value proposition of a price reduction motivates visitors to engage.
Performance of the best campaigns
The top 10% popup campaigns with discounts converted 60.63% of visitors.
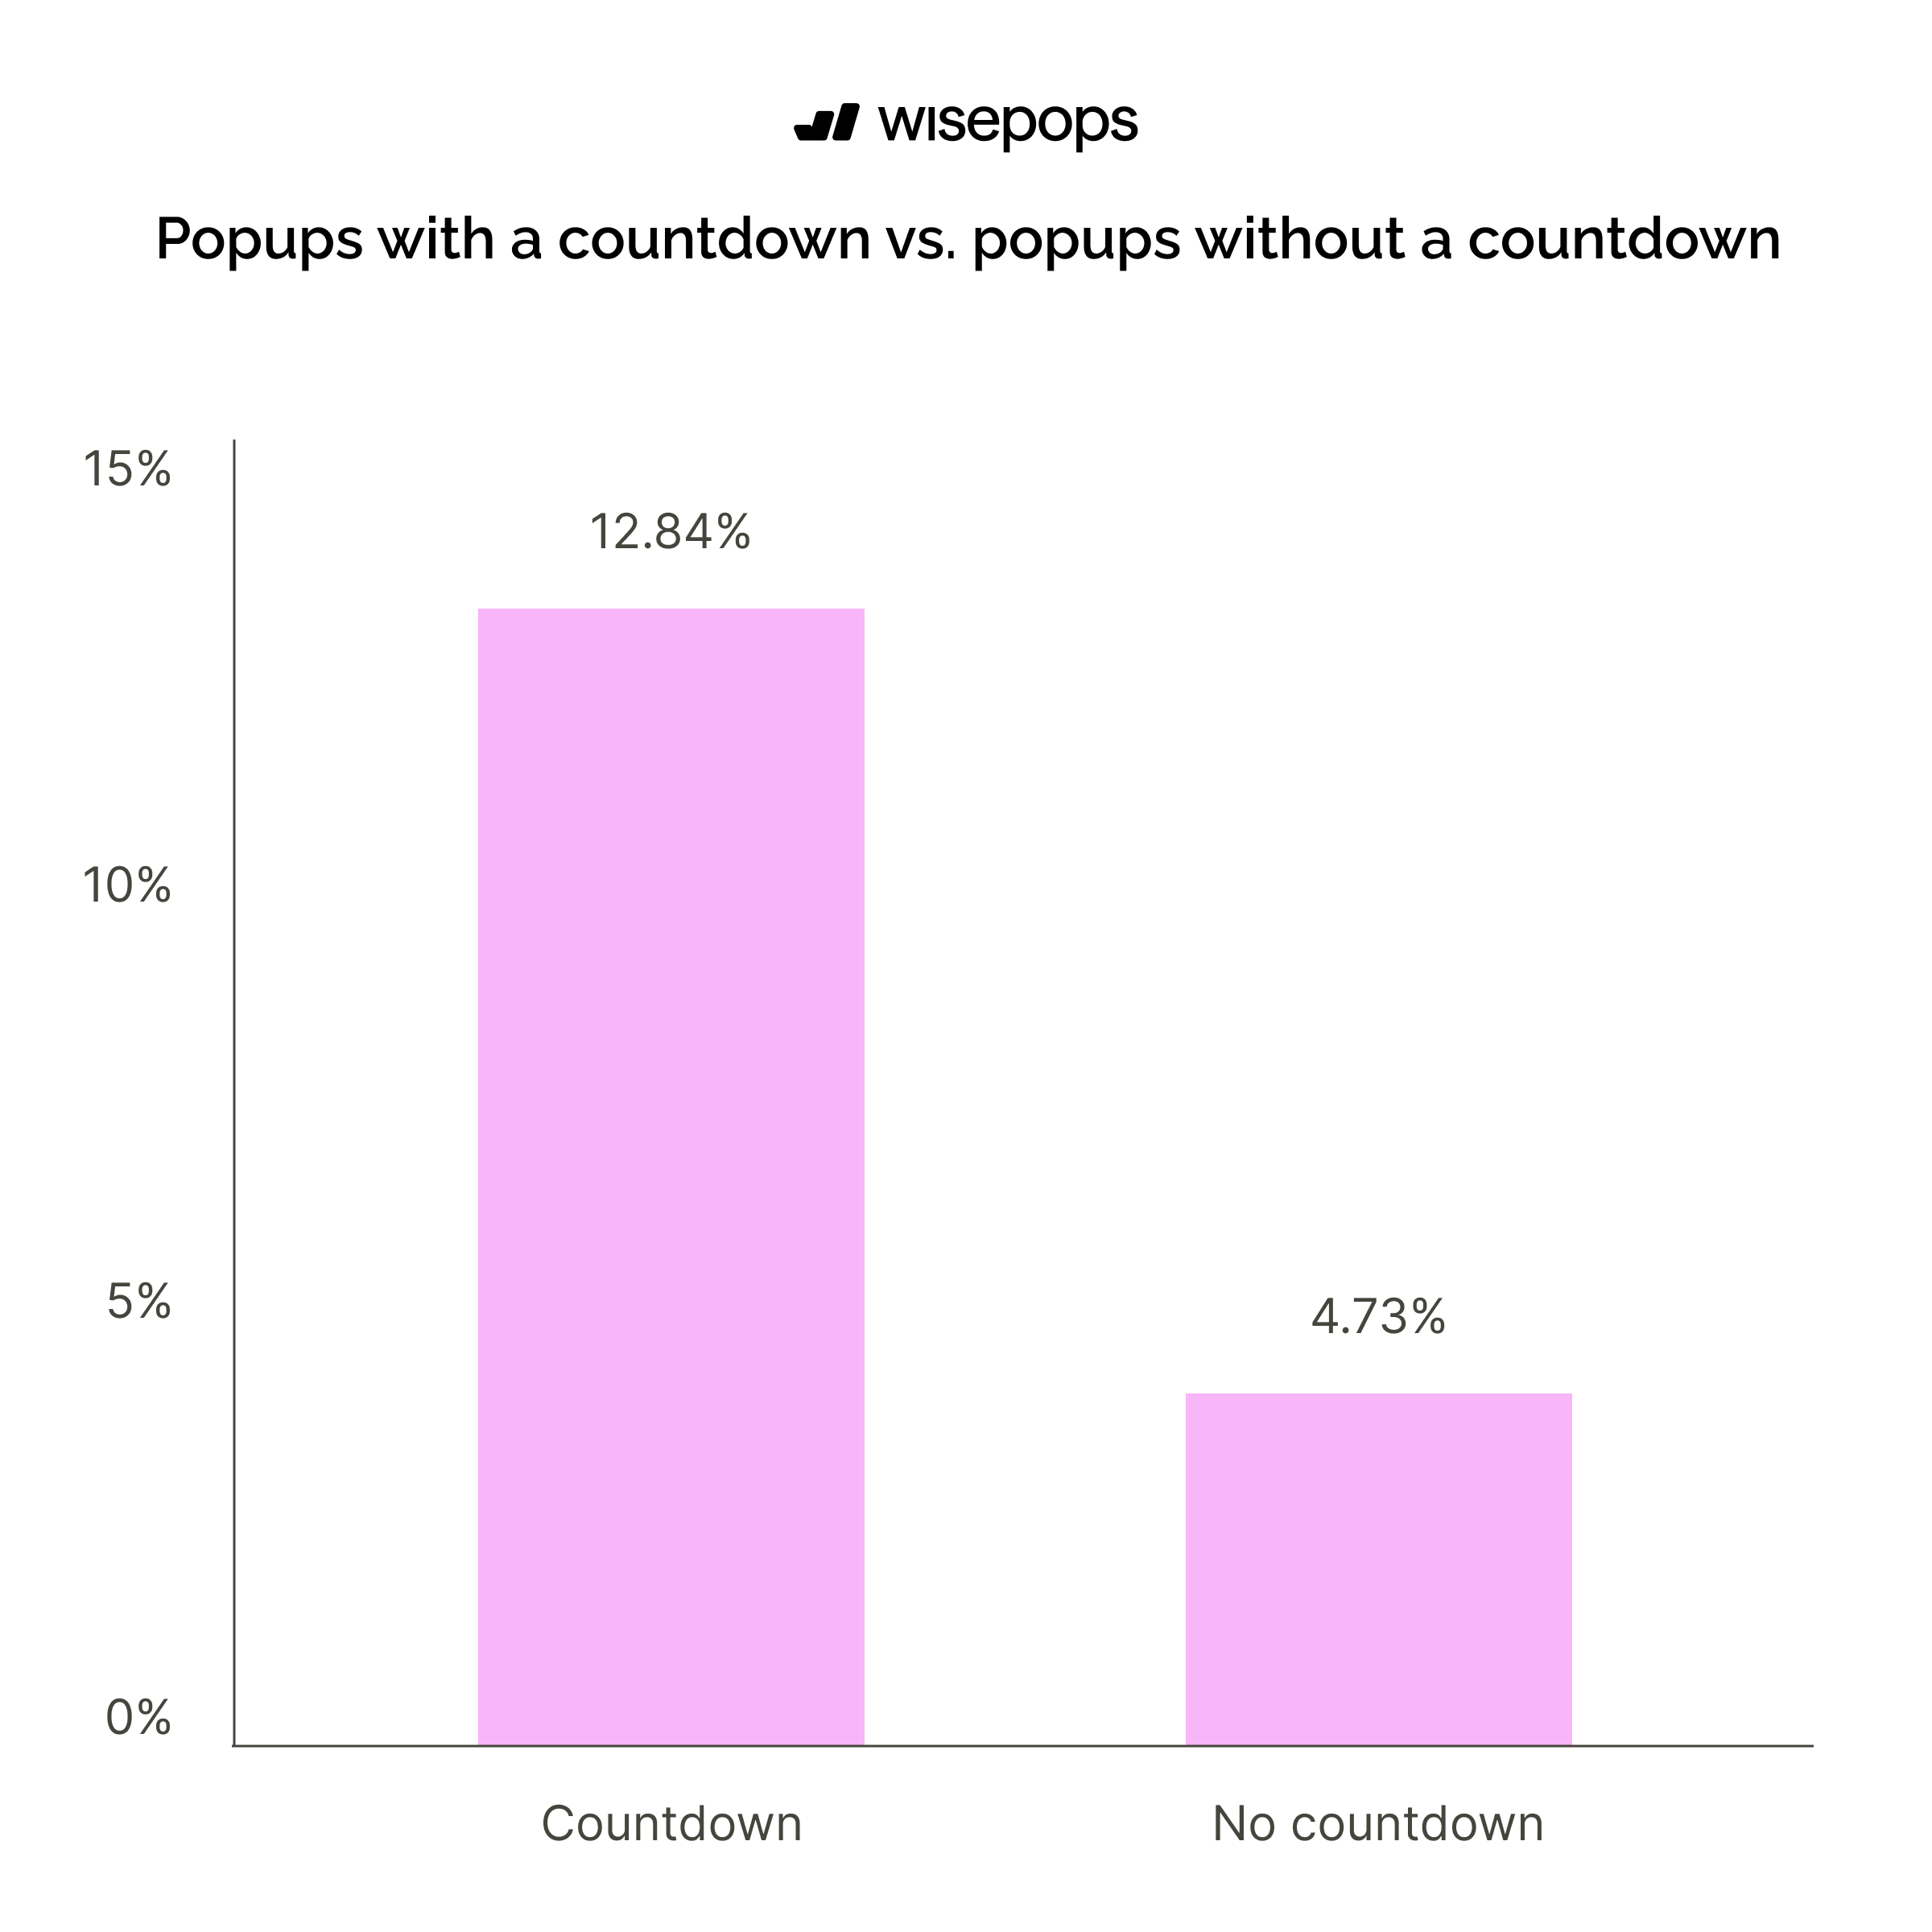
Do countdown timers increase popup conversions?
Popups with countdown timers achieve a 12.84% conversion rate, which is 171% higher than popups without countdowns at 4.73%.
This dramatic performance boost demonstrates that countdown timers create powerful urgency that motivates immediate action, though it's important to note that this tactic works best during genuine time-limited offers where the scarcity is authentic.
Performance of the top 10% of campaigns
The best-performing campaigns with countdowns converted 36.16% of visitors.
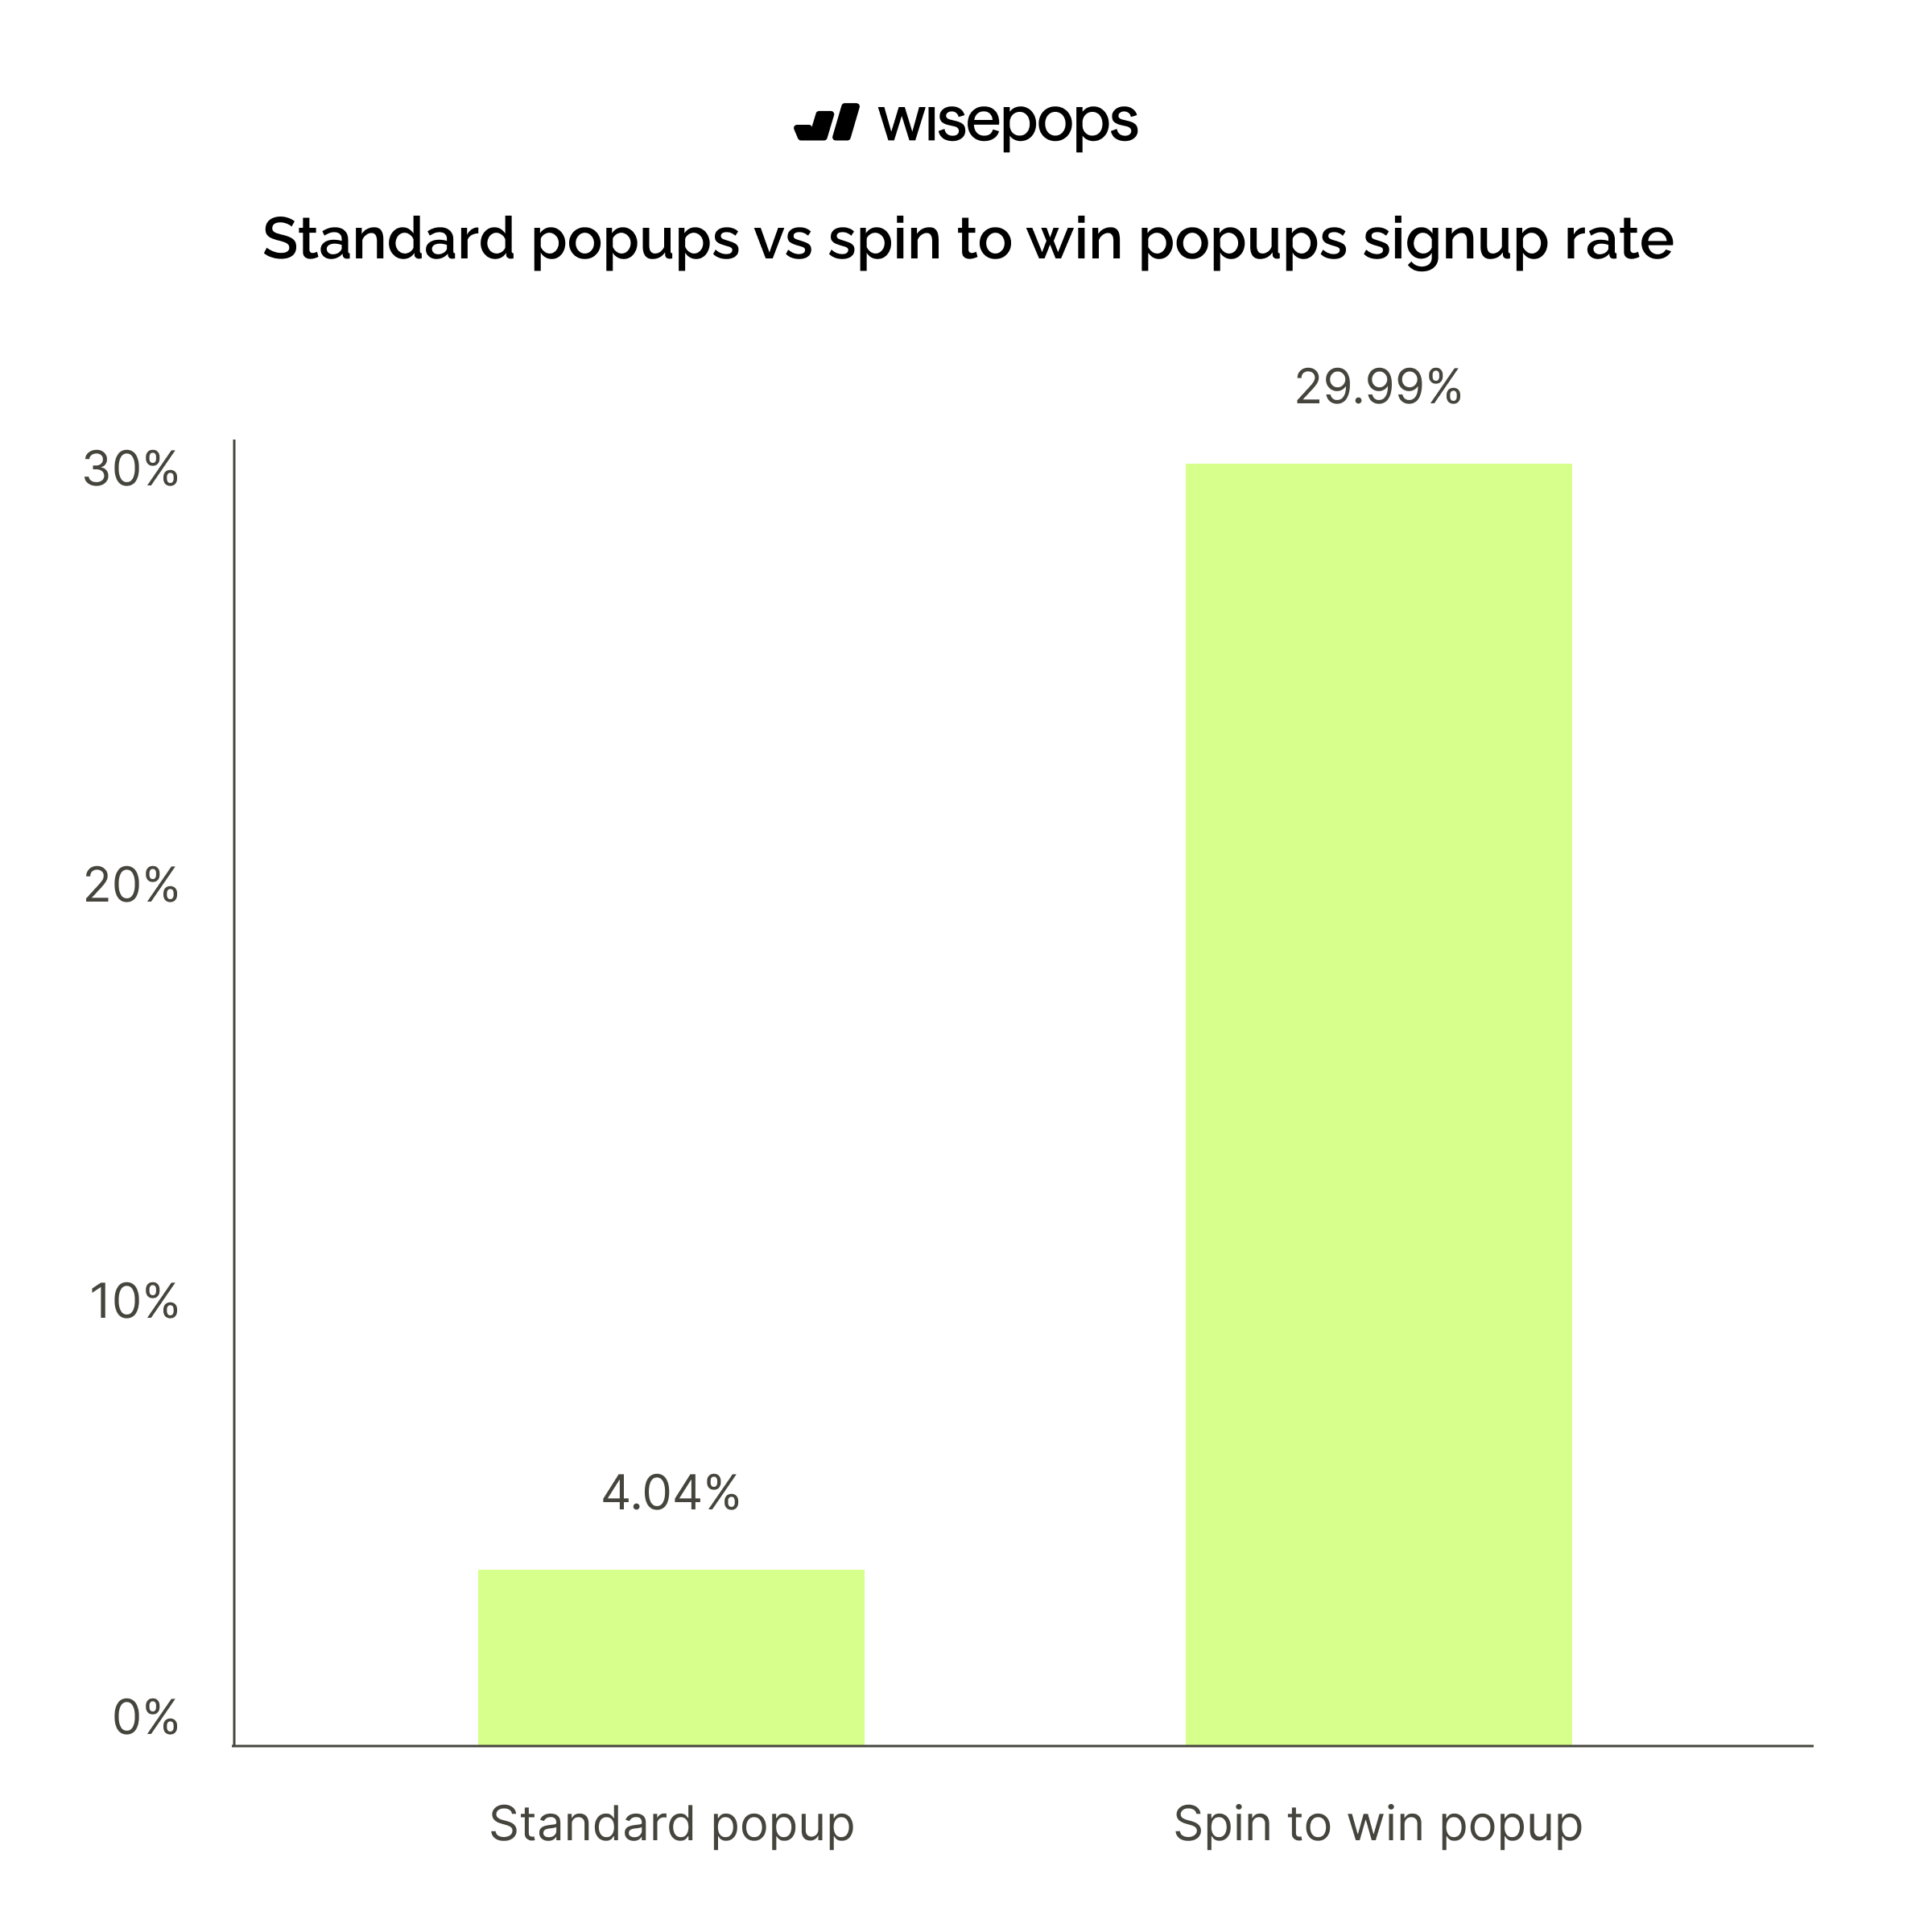
How effective are spin-to-win popups compared to traditional popups?
Spin-to-win popups achieve an extraordinary 29.99% conversion rate, which is 642% higher than traditional popups at 4.04%.
These gamified wheel popups dramatically outperform standard formats by transforming the conversion experience into an interactive game
Performance of the top 10% of campaigns
The best-performing campaigns with gamified elements converted 59.18% of visitors.
Does custom targeting improve popup conversion rates?
Popups with custom targeting achieve a 4.92% conversion rate compared to 4.81% without targeting, showing a modest 2.3% improvement.
While the performance difference appears small at the aggregate level, personalized popups that leverage visitor behavior, purchase history, or demographics deliver more relevant messages that resonate with specific audience segments.

Note: With custom properties, you can target visitors based on criteria you define—such as customers who bought over three days ago, visitors who have added one item to their shopping cart, or those in a specific subscriber segment in Klaviyo.
Learn more about how to set up custom properties in popups
Performance of the top 10% of campaigns
The best-performing popup campaigns using custom targeting properties converted 45.30% of visitors.
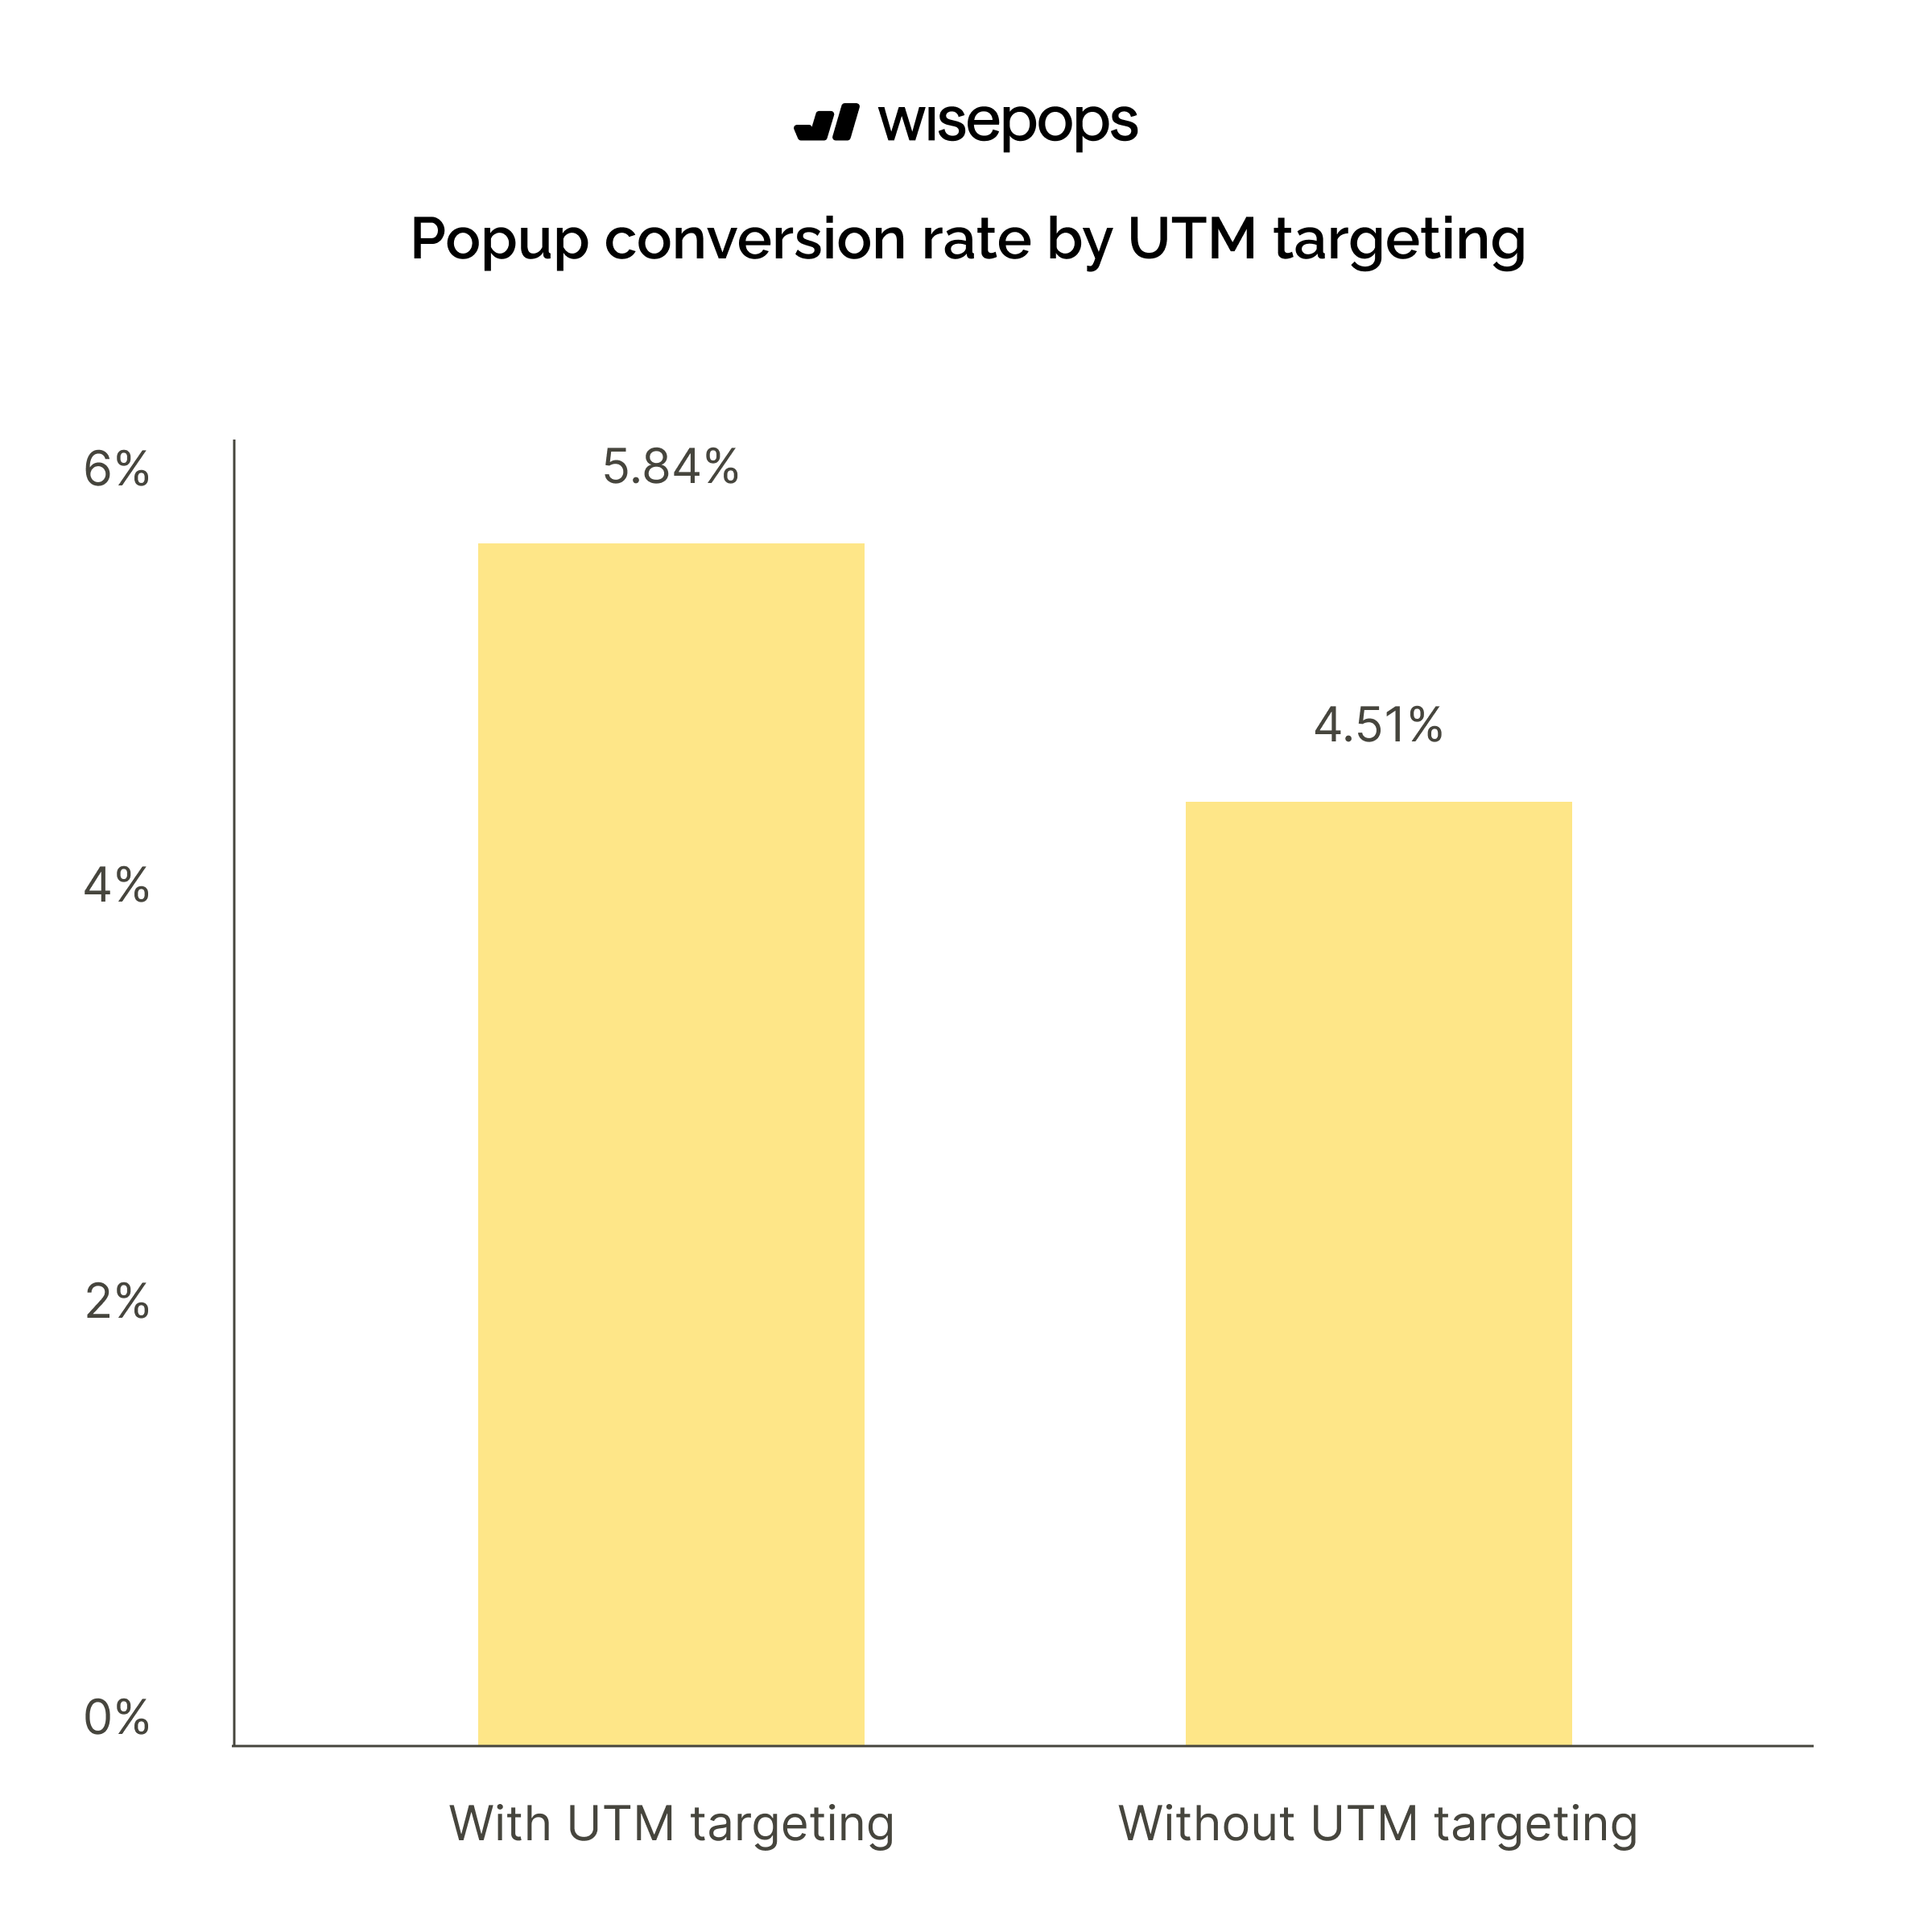
Popups with UTM targeting deliver higher conversion rates than non-targeted campaigns
Popups using UTM targeting achieve a 5.84% conversion rate compared to 4.51% for popups without UTM targeting.
Theses results show that using UTM parameters (which track traffic sources like email campaigns, social media ads, or paid search) allows businesses to show more contextually relevant popups based on where visitors came from, creating personalized experiences.
Which popup trigger has the highest conversion rate?
Click-triggered popups achieve an exceptional 54.42% conversion rate, making them the most effective popup trigger by far, s visitors who actively click on an element have already signaled their interest and intent, making them pre-qualified leads who are more likely to complete the conversion
Hover-based popups follow with 13.05%, while AI-powered triggers* reach 15.98%, and custom event popups achieve 10.35%. Scroll-based popups convert at 5.37%, landing popups at 4.72%, and exit-intent popups at 3.94%.
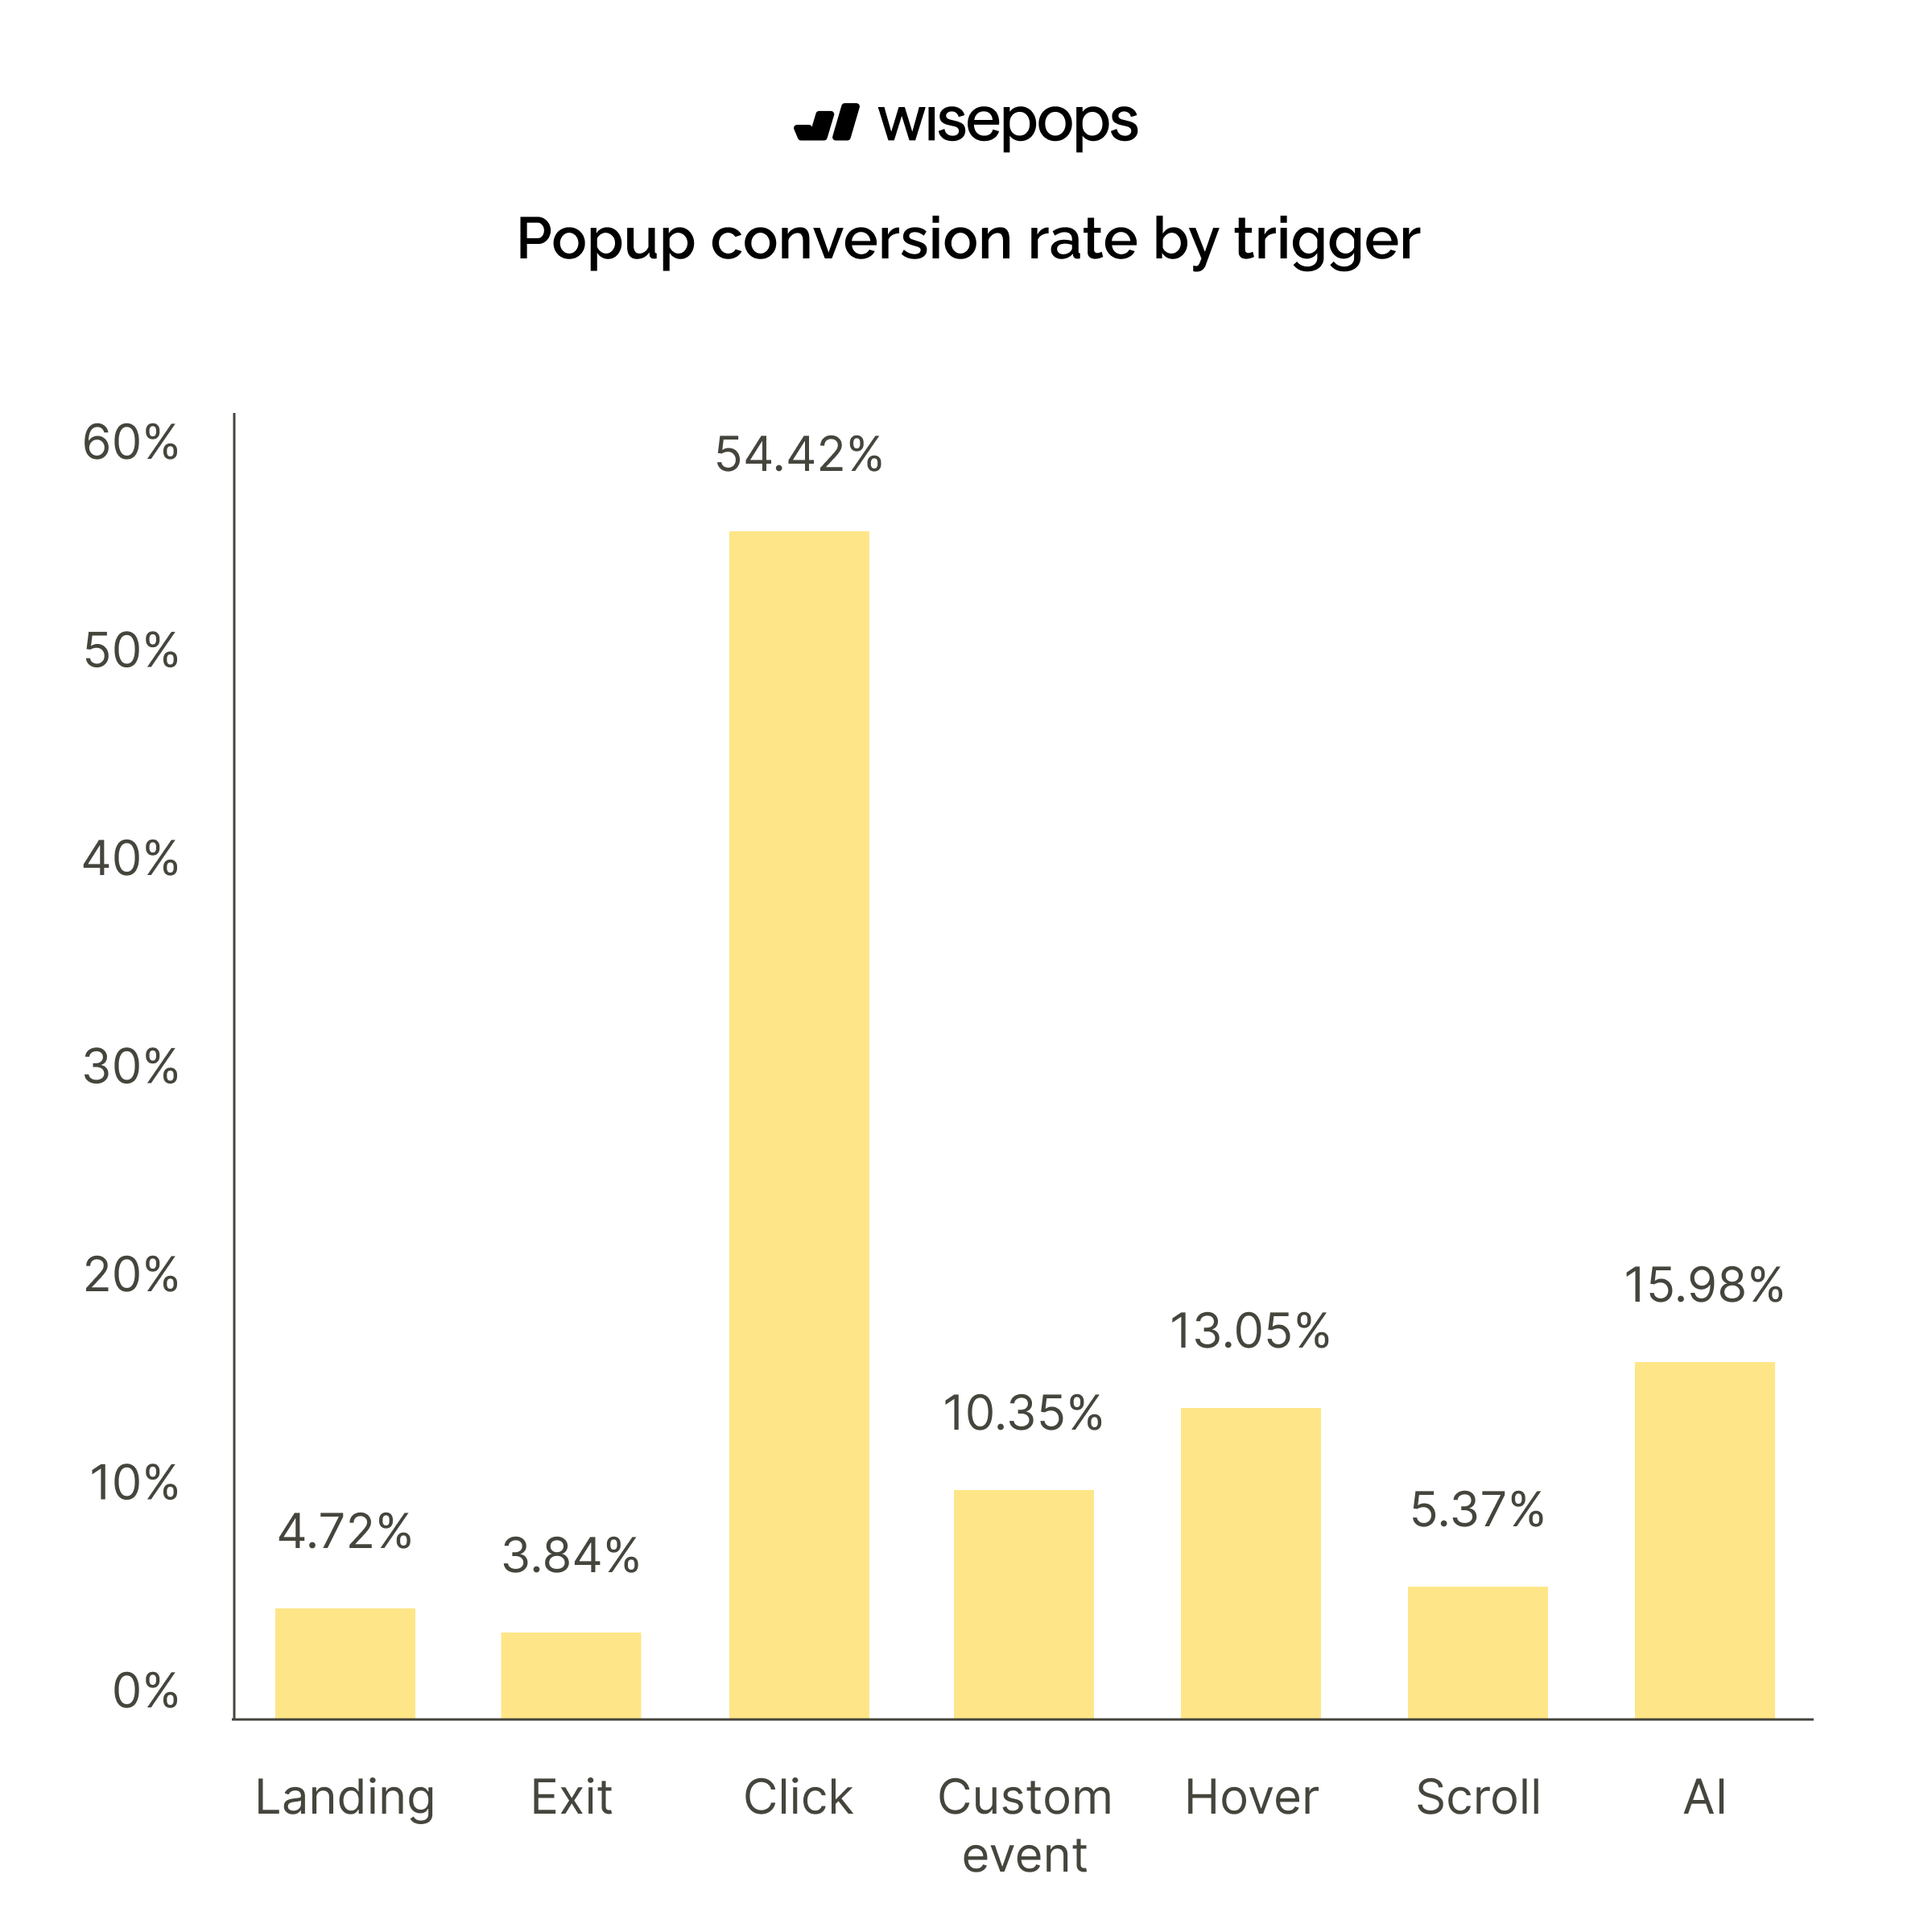
*AI triggers are a newer addition in Wisepops popup technology and have quickly become one of the highest-performing options for ecommerce businesses.
Top 10% campaigns‘ CVR:
On landing: 51.22%
On exit: 19.20%
On scroll: 26.60%
On click: 63.35%
On hover: 6.76%
On custom event: 62.00%
AI-enabled trigger: 51.80%
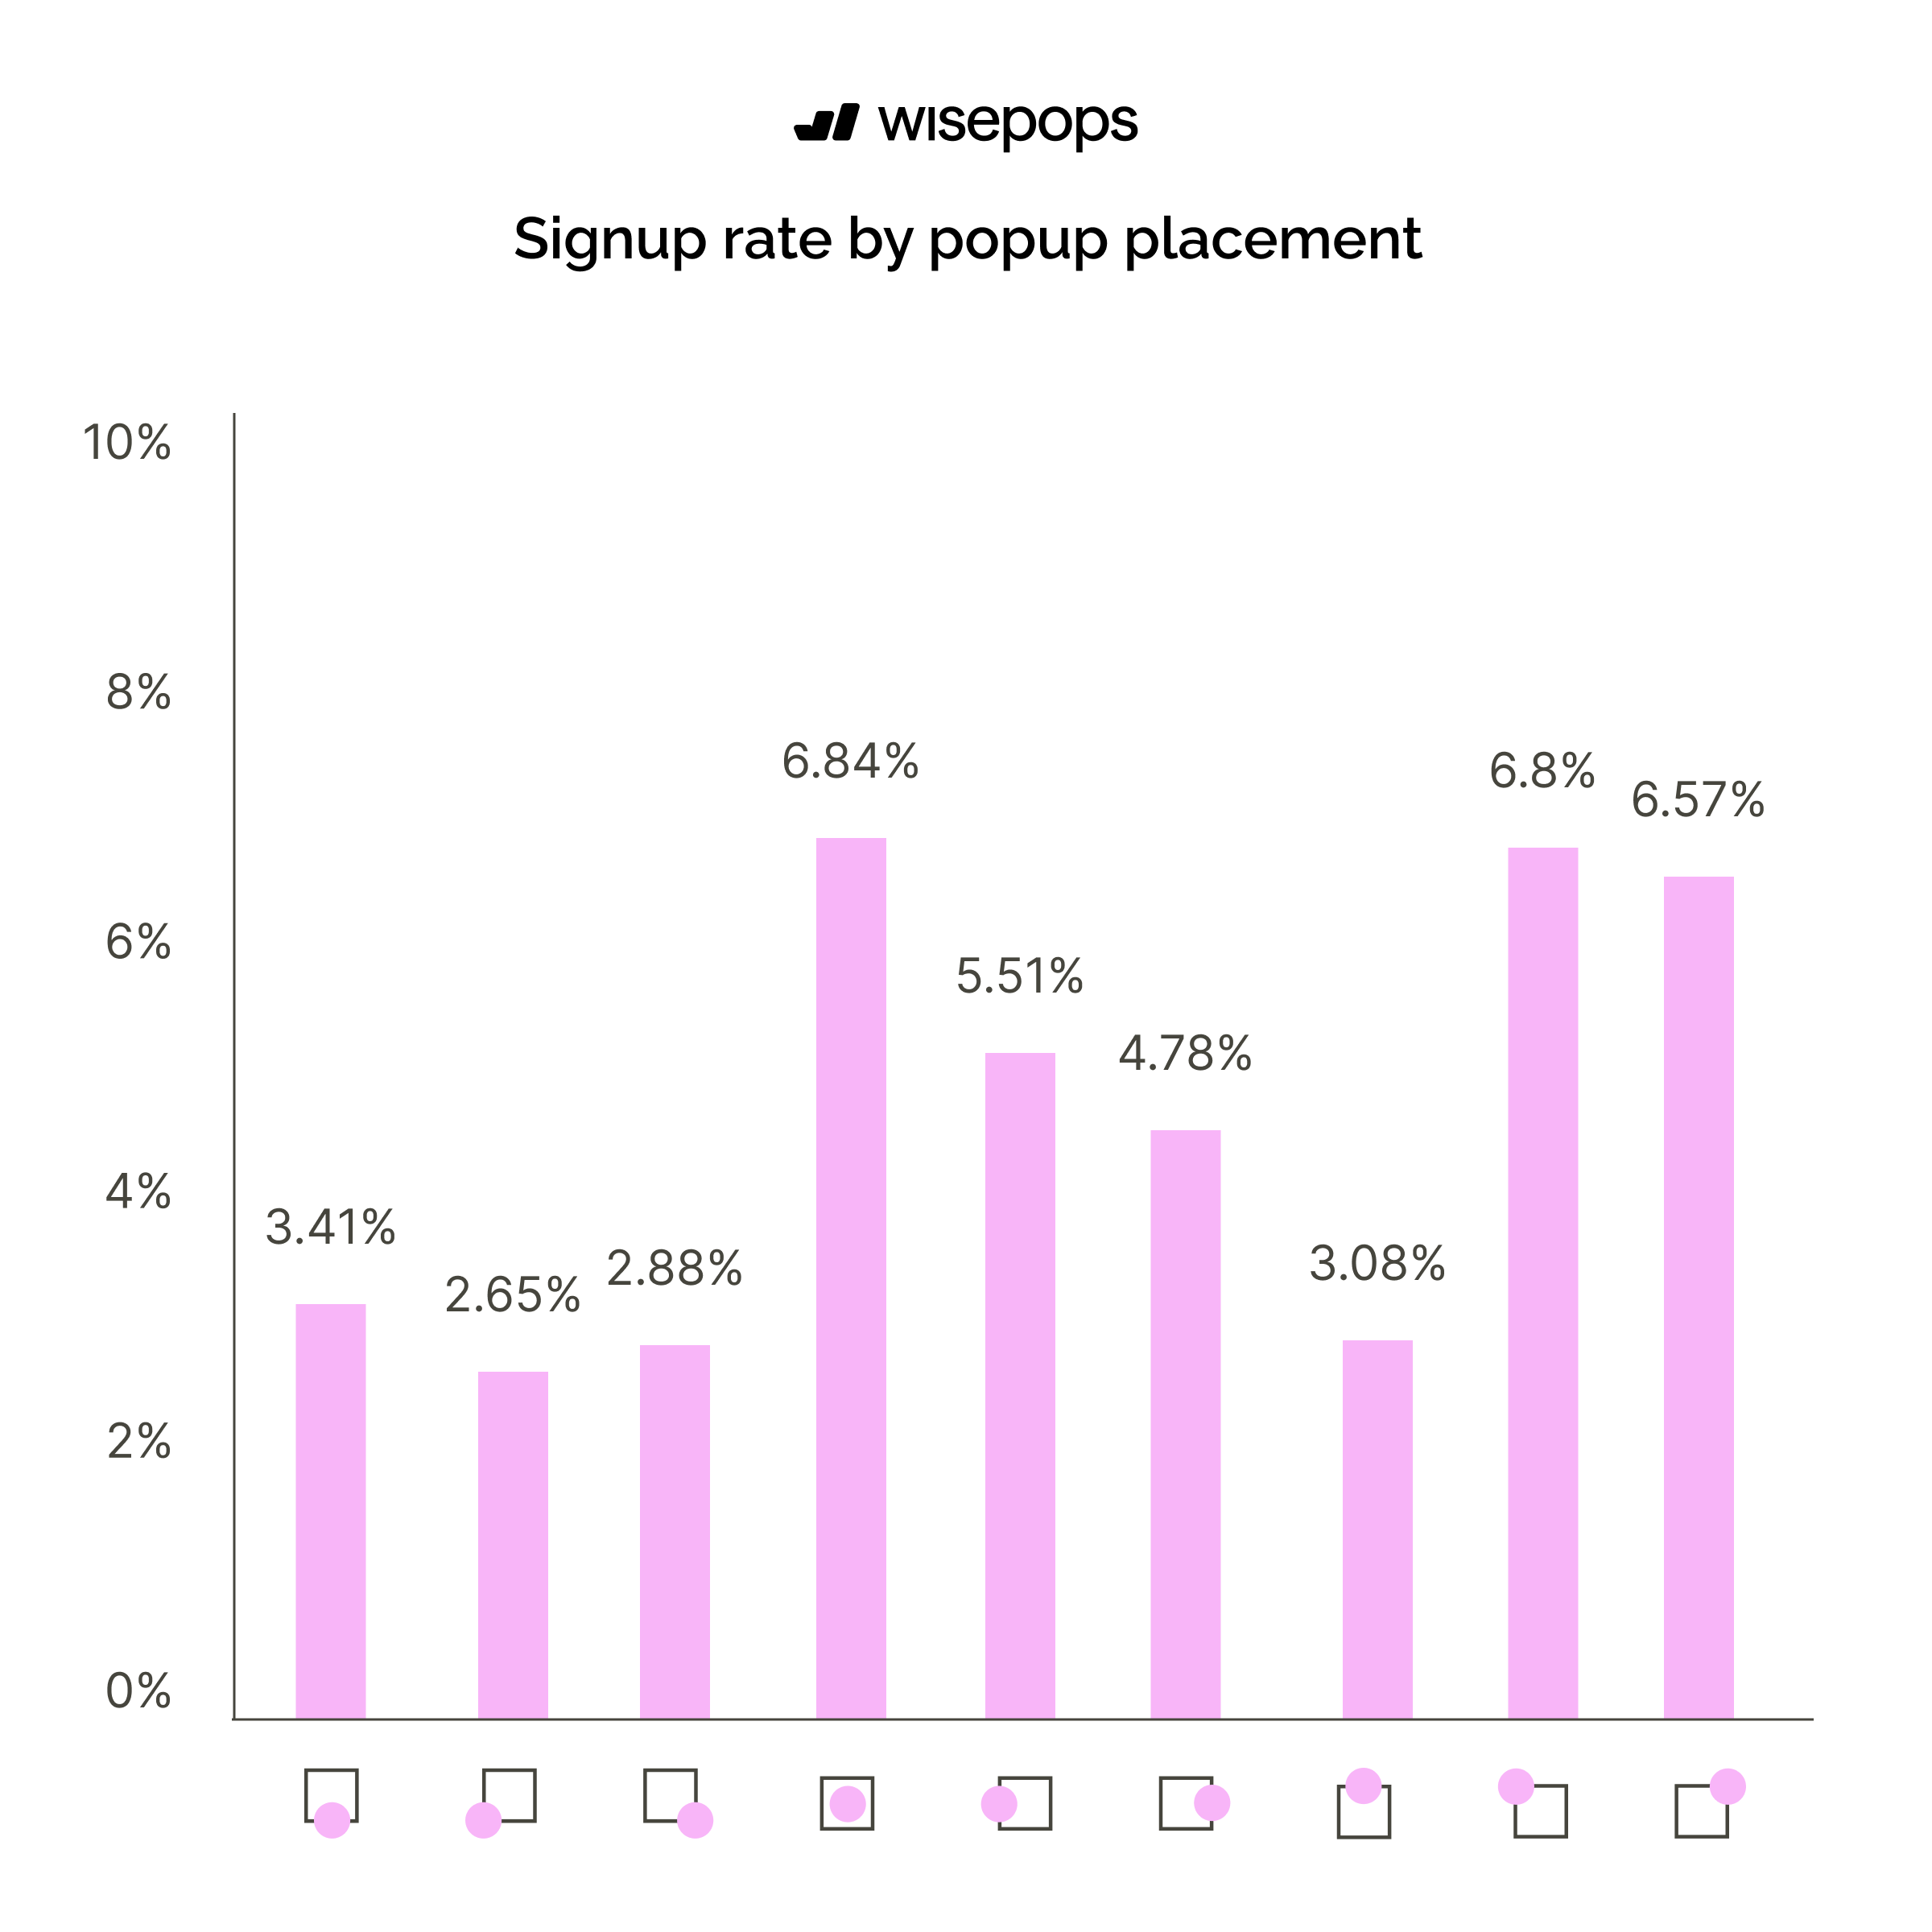
Where should you position popups for best conversion rates?
Center-positioned popups achieve the highest conversion rate at 6.84%, followed closely by top-left at 6.80% and top-right at 6.57%, demonstrating that prominent, centrally-placed popups that command visitor attention perform best.
Center-left positions convert at 5.51%, while bottom-center drops to 3.41%, and corner positions like bottom-left (2.65%) and bottom-right (2.88%) show the lowest performance, likely because these less intrusive placements are easier for visitors to overlook or ignore despite being less disruptive.
Top 10% campaigns‘ CVR:
Center: 61.06%
Bottom Center: 27.00%
Bottom Left: 71.82%
Bottom Right: 28.87%
Top Center: 41.50%
Top Left: 23.33%
Top Right: 28.75%
Center Right: 45.68%
Center Left: 20.08%
Did you know that Wisepops hosted a popup contest?
Seven campaigns, thousands of collected leads, and plenty of awesome ideas.
When is the best time to display a popup for maximum conversions?
Popups displayed between 11-15 seconds achieve the highest conversion rate at 6.45%, striking the optimal balance between giving visitors time to engage and capturing their attention before they leave.
Popups shown at 6-10 seconds (5.98%) and 1-5 seconds (5.93%) also perform well, though immediate popups (0 seconds) convert lower at 4.16%, while waiting too long significantly hurts performance, with 16-20 second delays dropping to 2.95% and 21-30 seconds falling to just 1.53%.

Top 10% campaigns‘ CVR:
immediate display: 67.49%
1-5 sec: 41.87%
6-10 sec: 26.97%
11-15 sec: 14.46%
16-20 sec: 10.56%
21-30 sec: 10.94%
31-60 sec: 9.57%
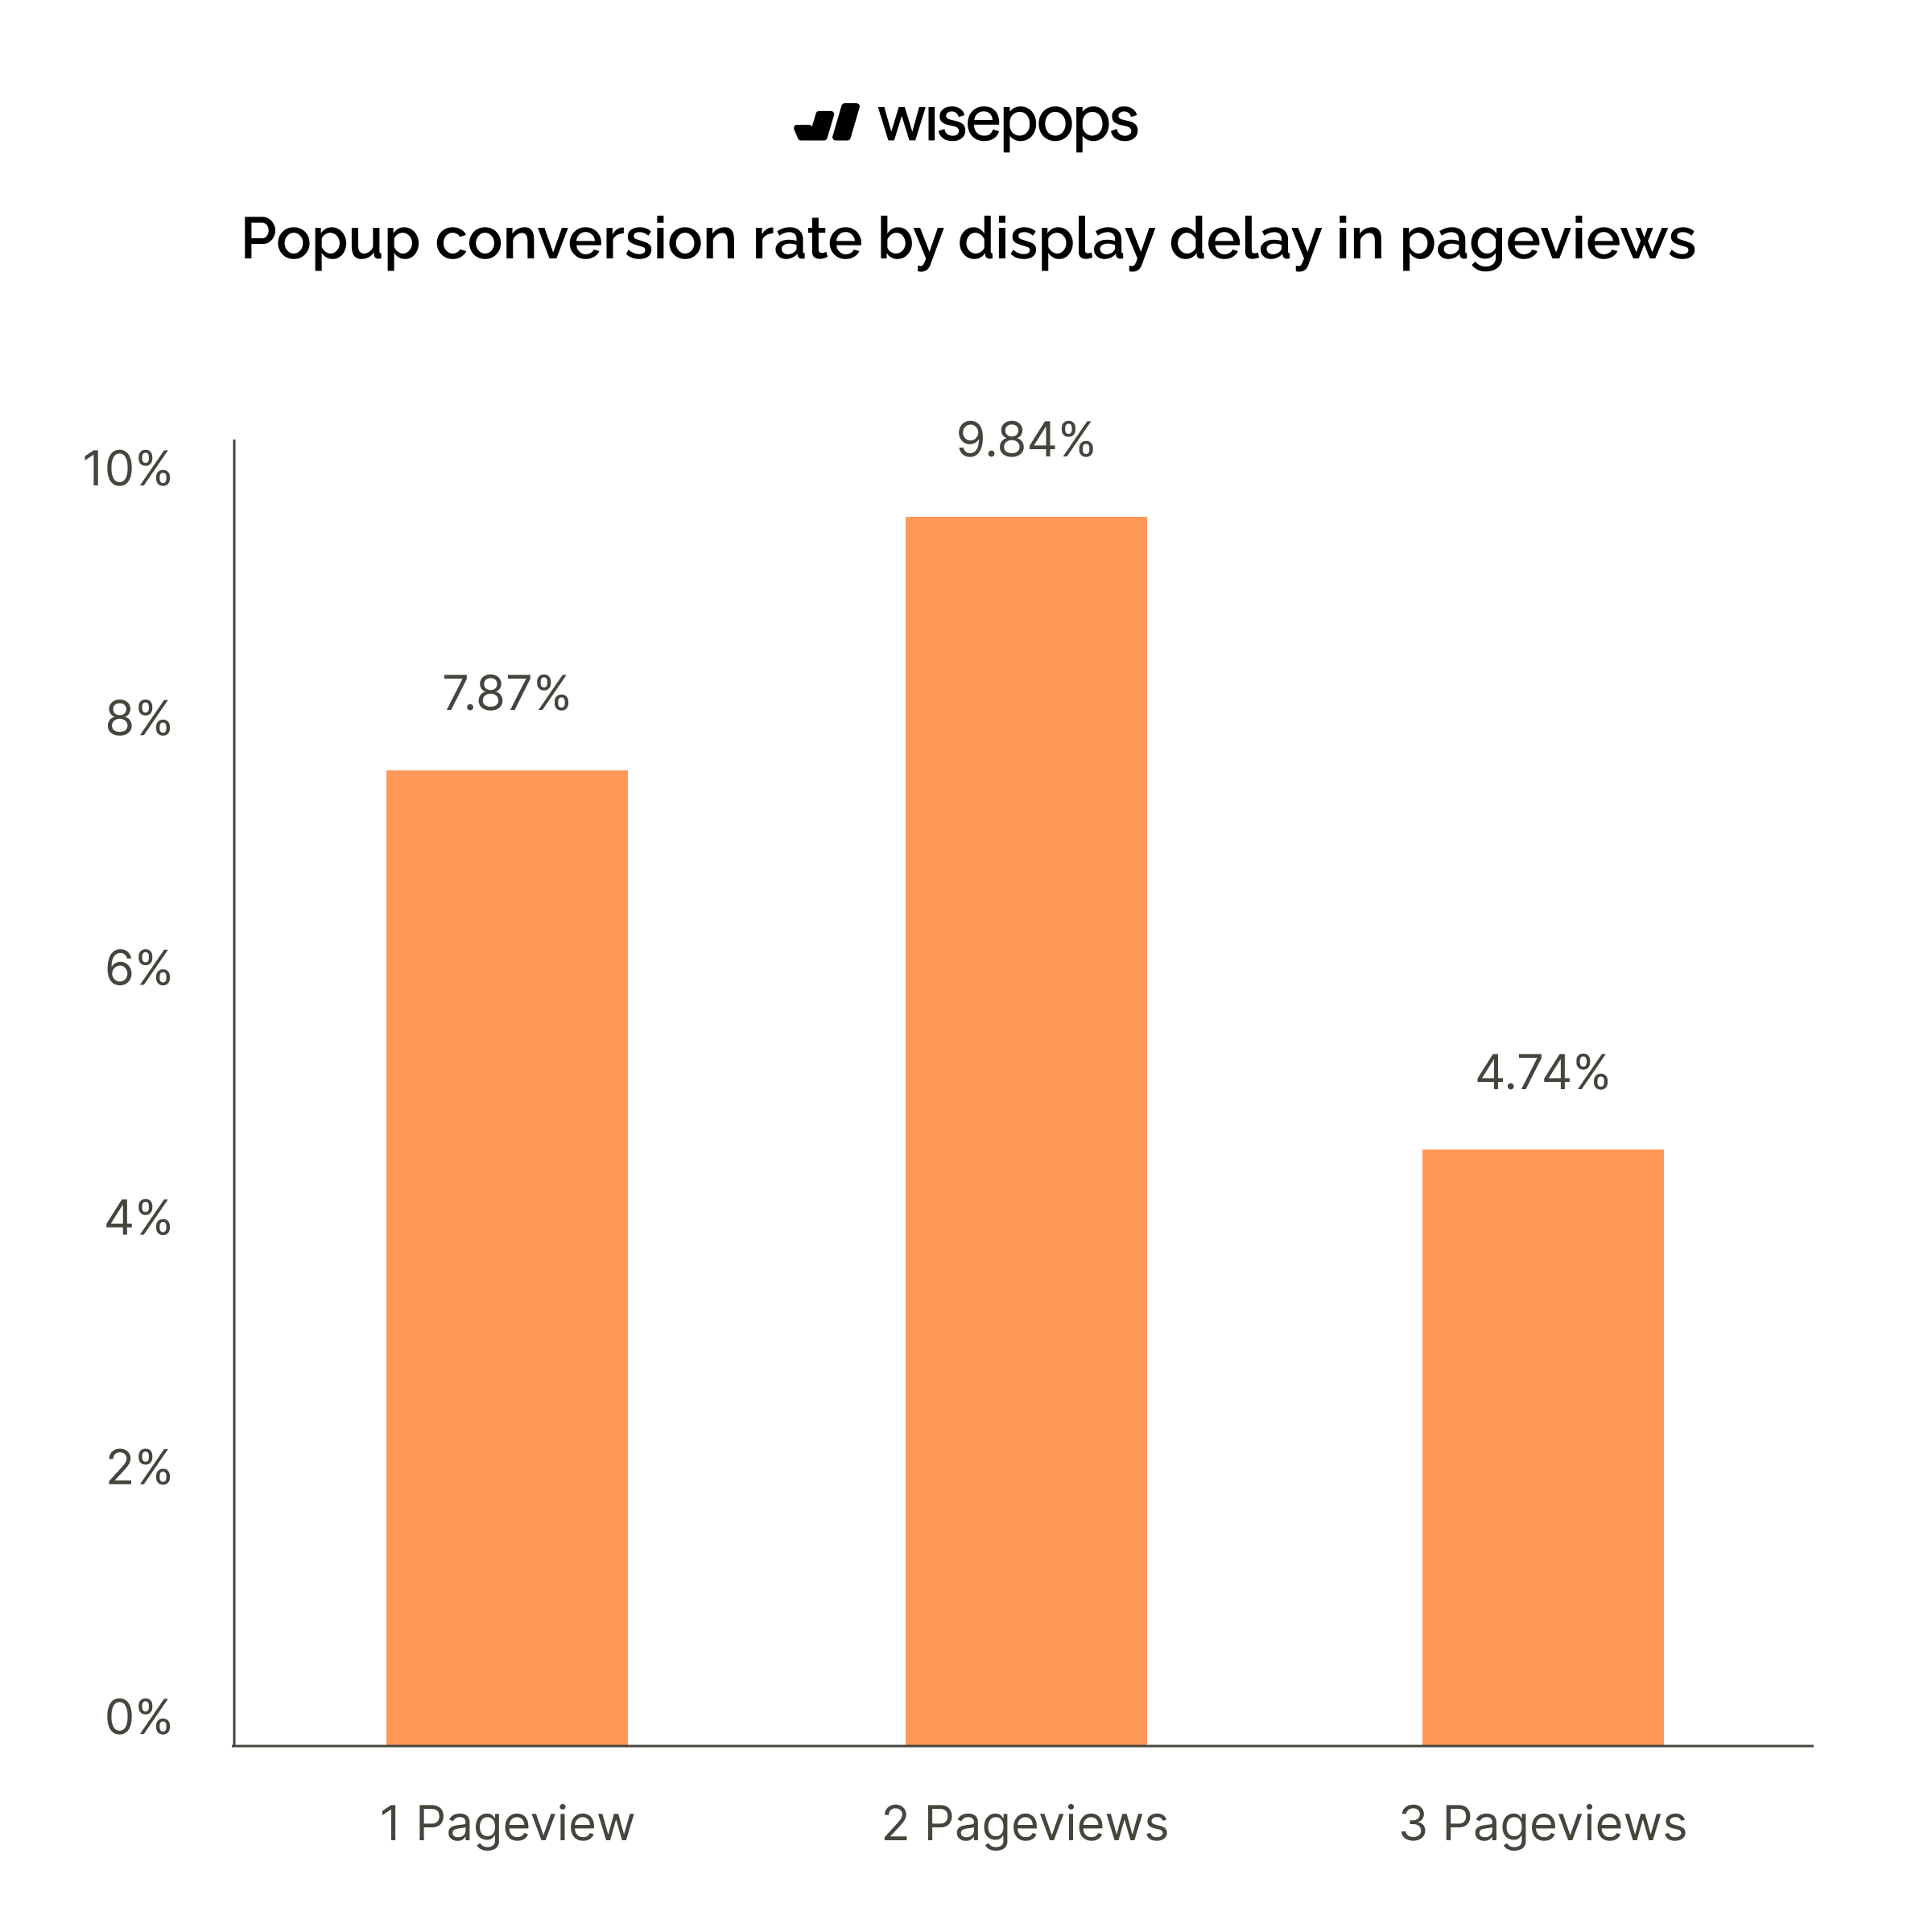
How many pageviews should you wait before showing a popup?
Popups displayed after a 2-page delay achieve the highest conversion rate at 9.84%, indicating that visitors who view multiple pages are more engaged and qualified leads.
Single-page delays convert at 7.87%, while waiting for 3 pages drops significantly to 4.74%, suggesting that the optimal window for popup display is after visitors have demonstrated initial interest by viewing 1-2 pages but before they become too deep or lose interest.
Top 10% campaigns‘ CVR:
one page delay: 52.09%
two-page delay: 31.62%
three-page delay: 16.76%
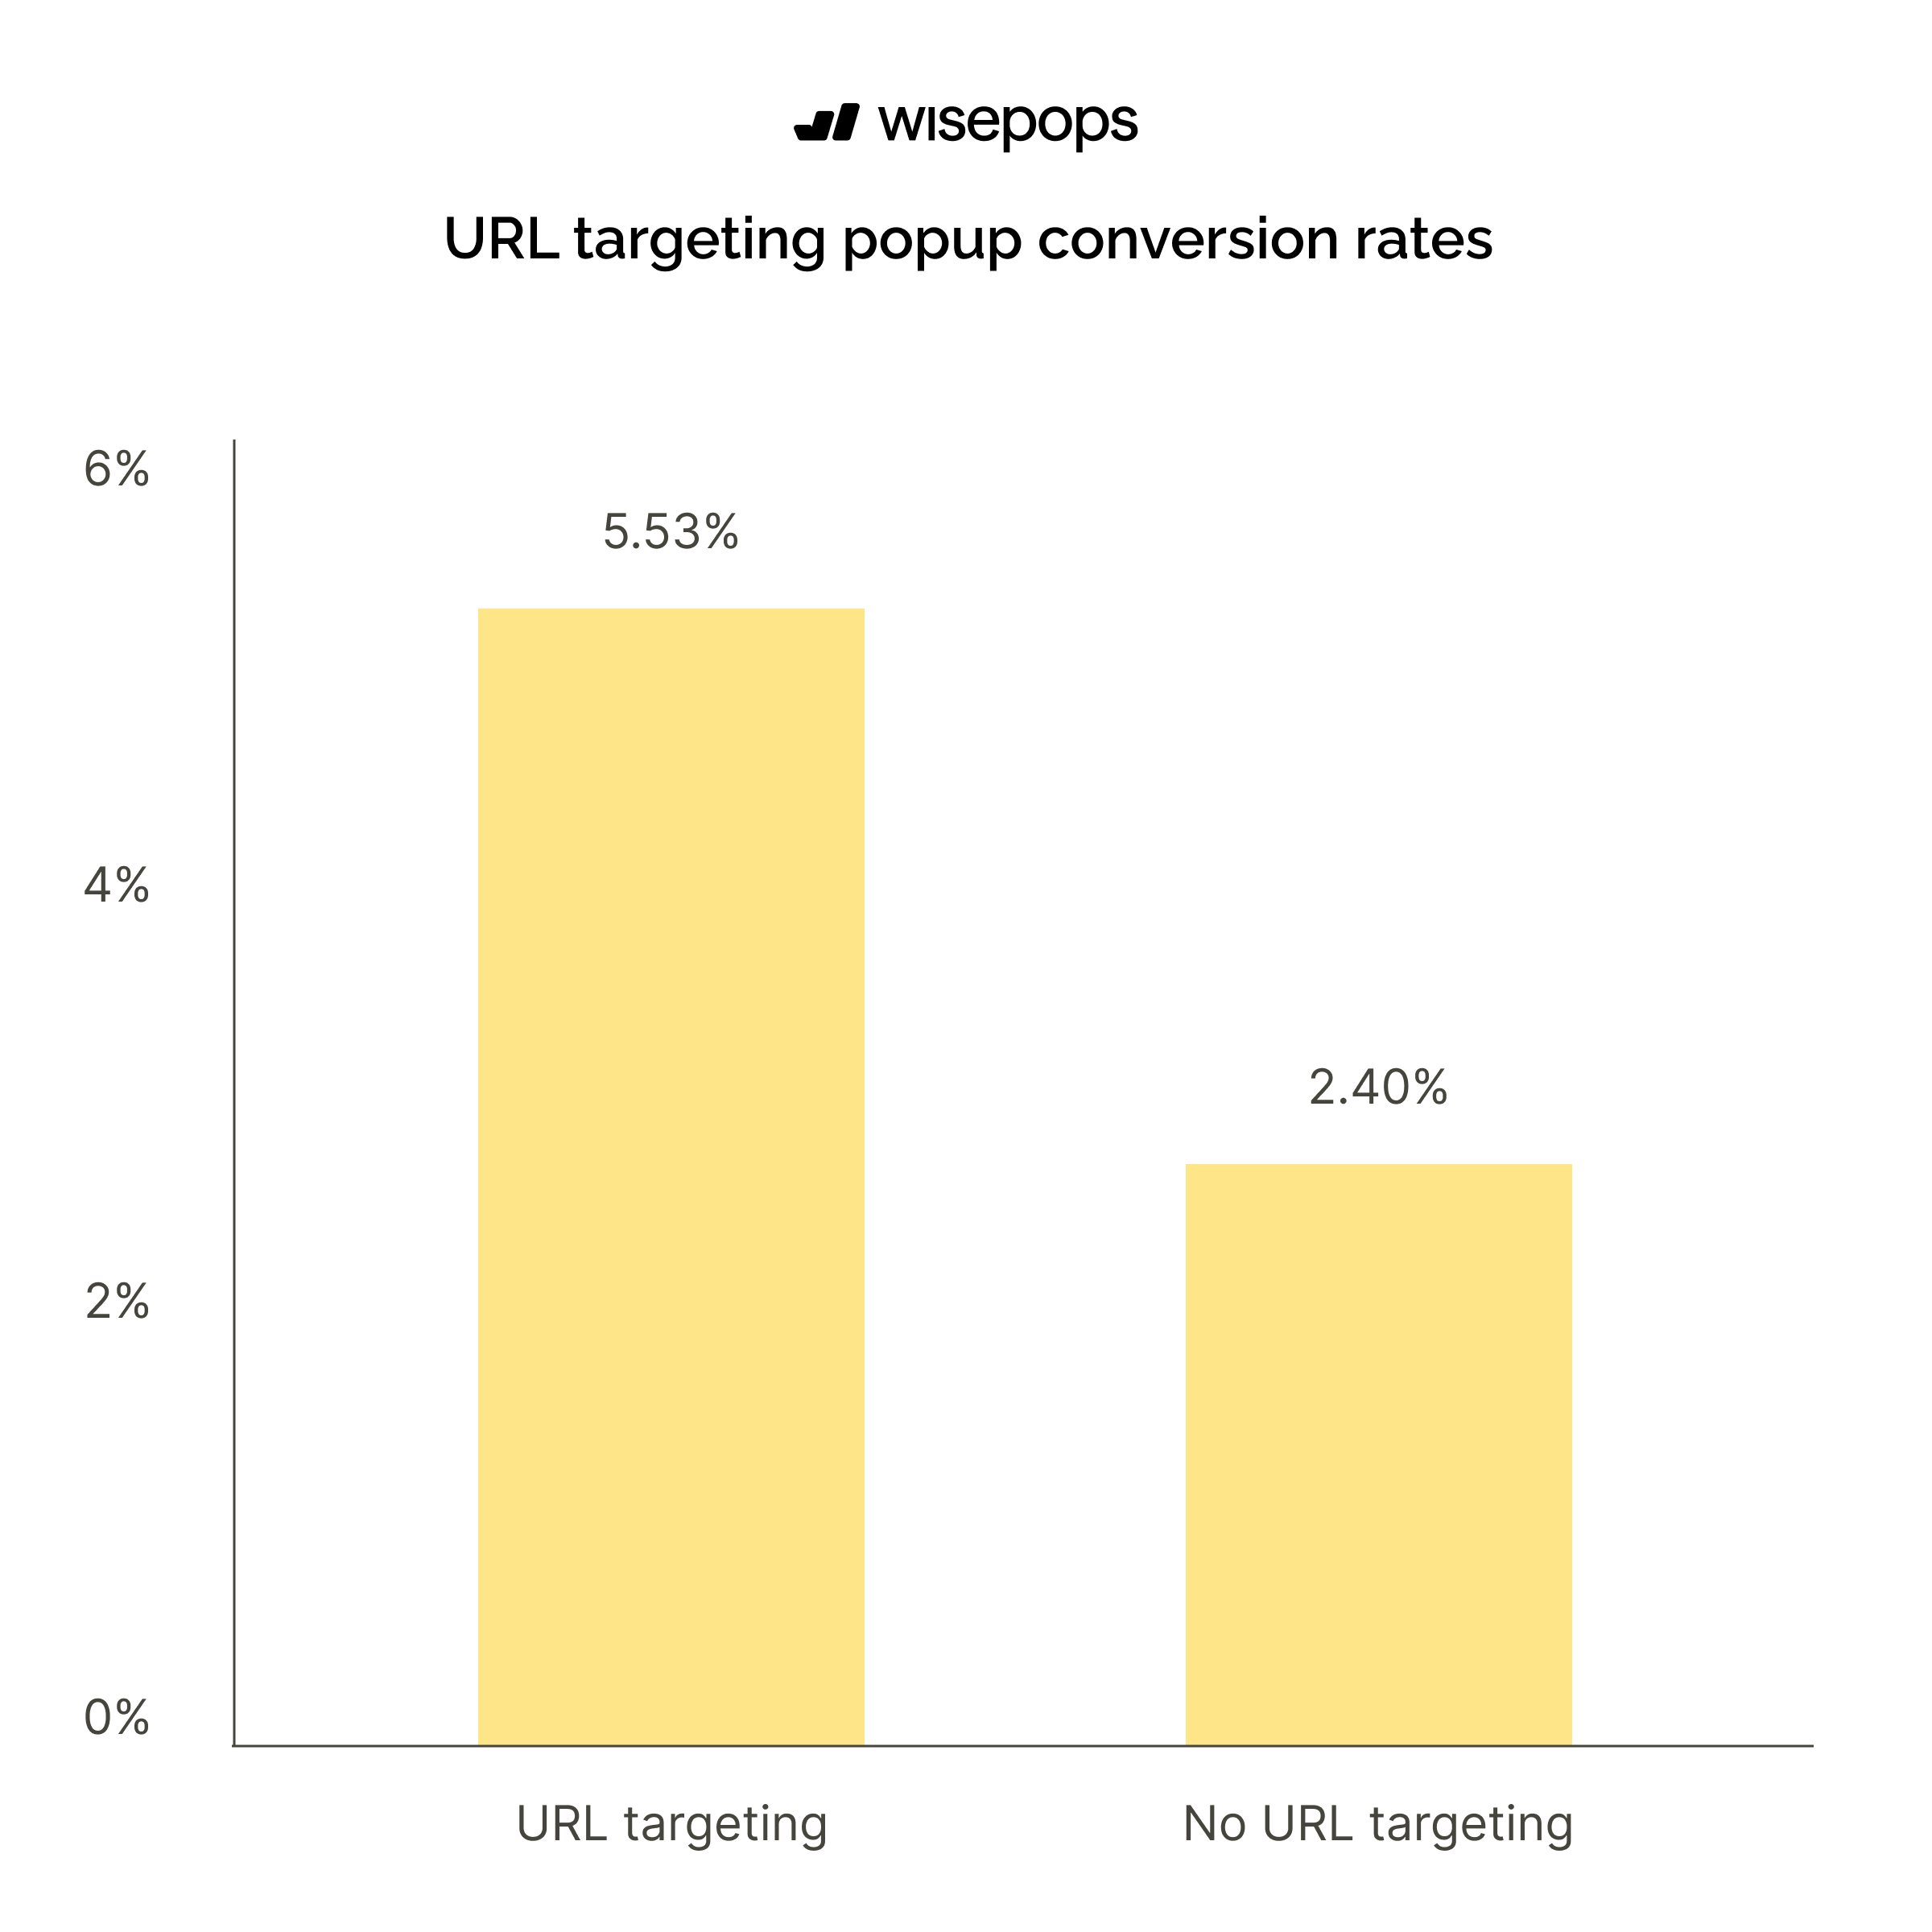
Does URL targeting improve popup conversion rates?
Popups with URL targeting achieve a 5.53% conversion rate, which is 130% higher than popups without URL targeting at 2.40%.
This substantial performance boost demonstrates that showing contextually relevant popups based on the specific page a visitor is viewing significantly increases engagement and conversions by delivering the right message at the right moment in the visitor's journey.
Top 10% campaigns' CVR:
The top 10% of campaigns deliver a 54.76% conversion rate.
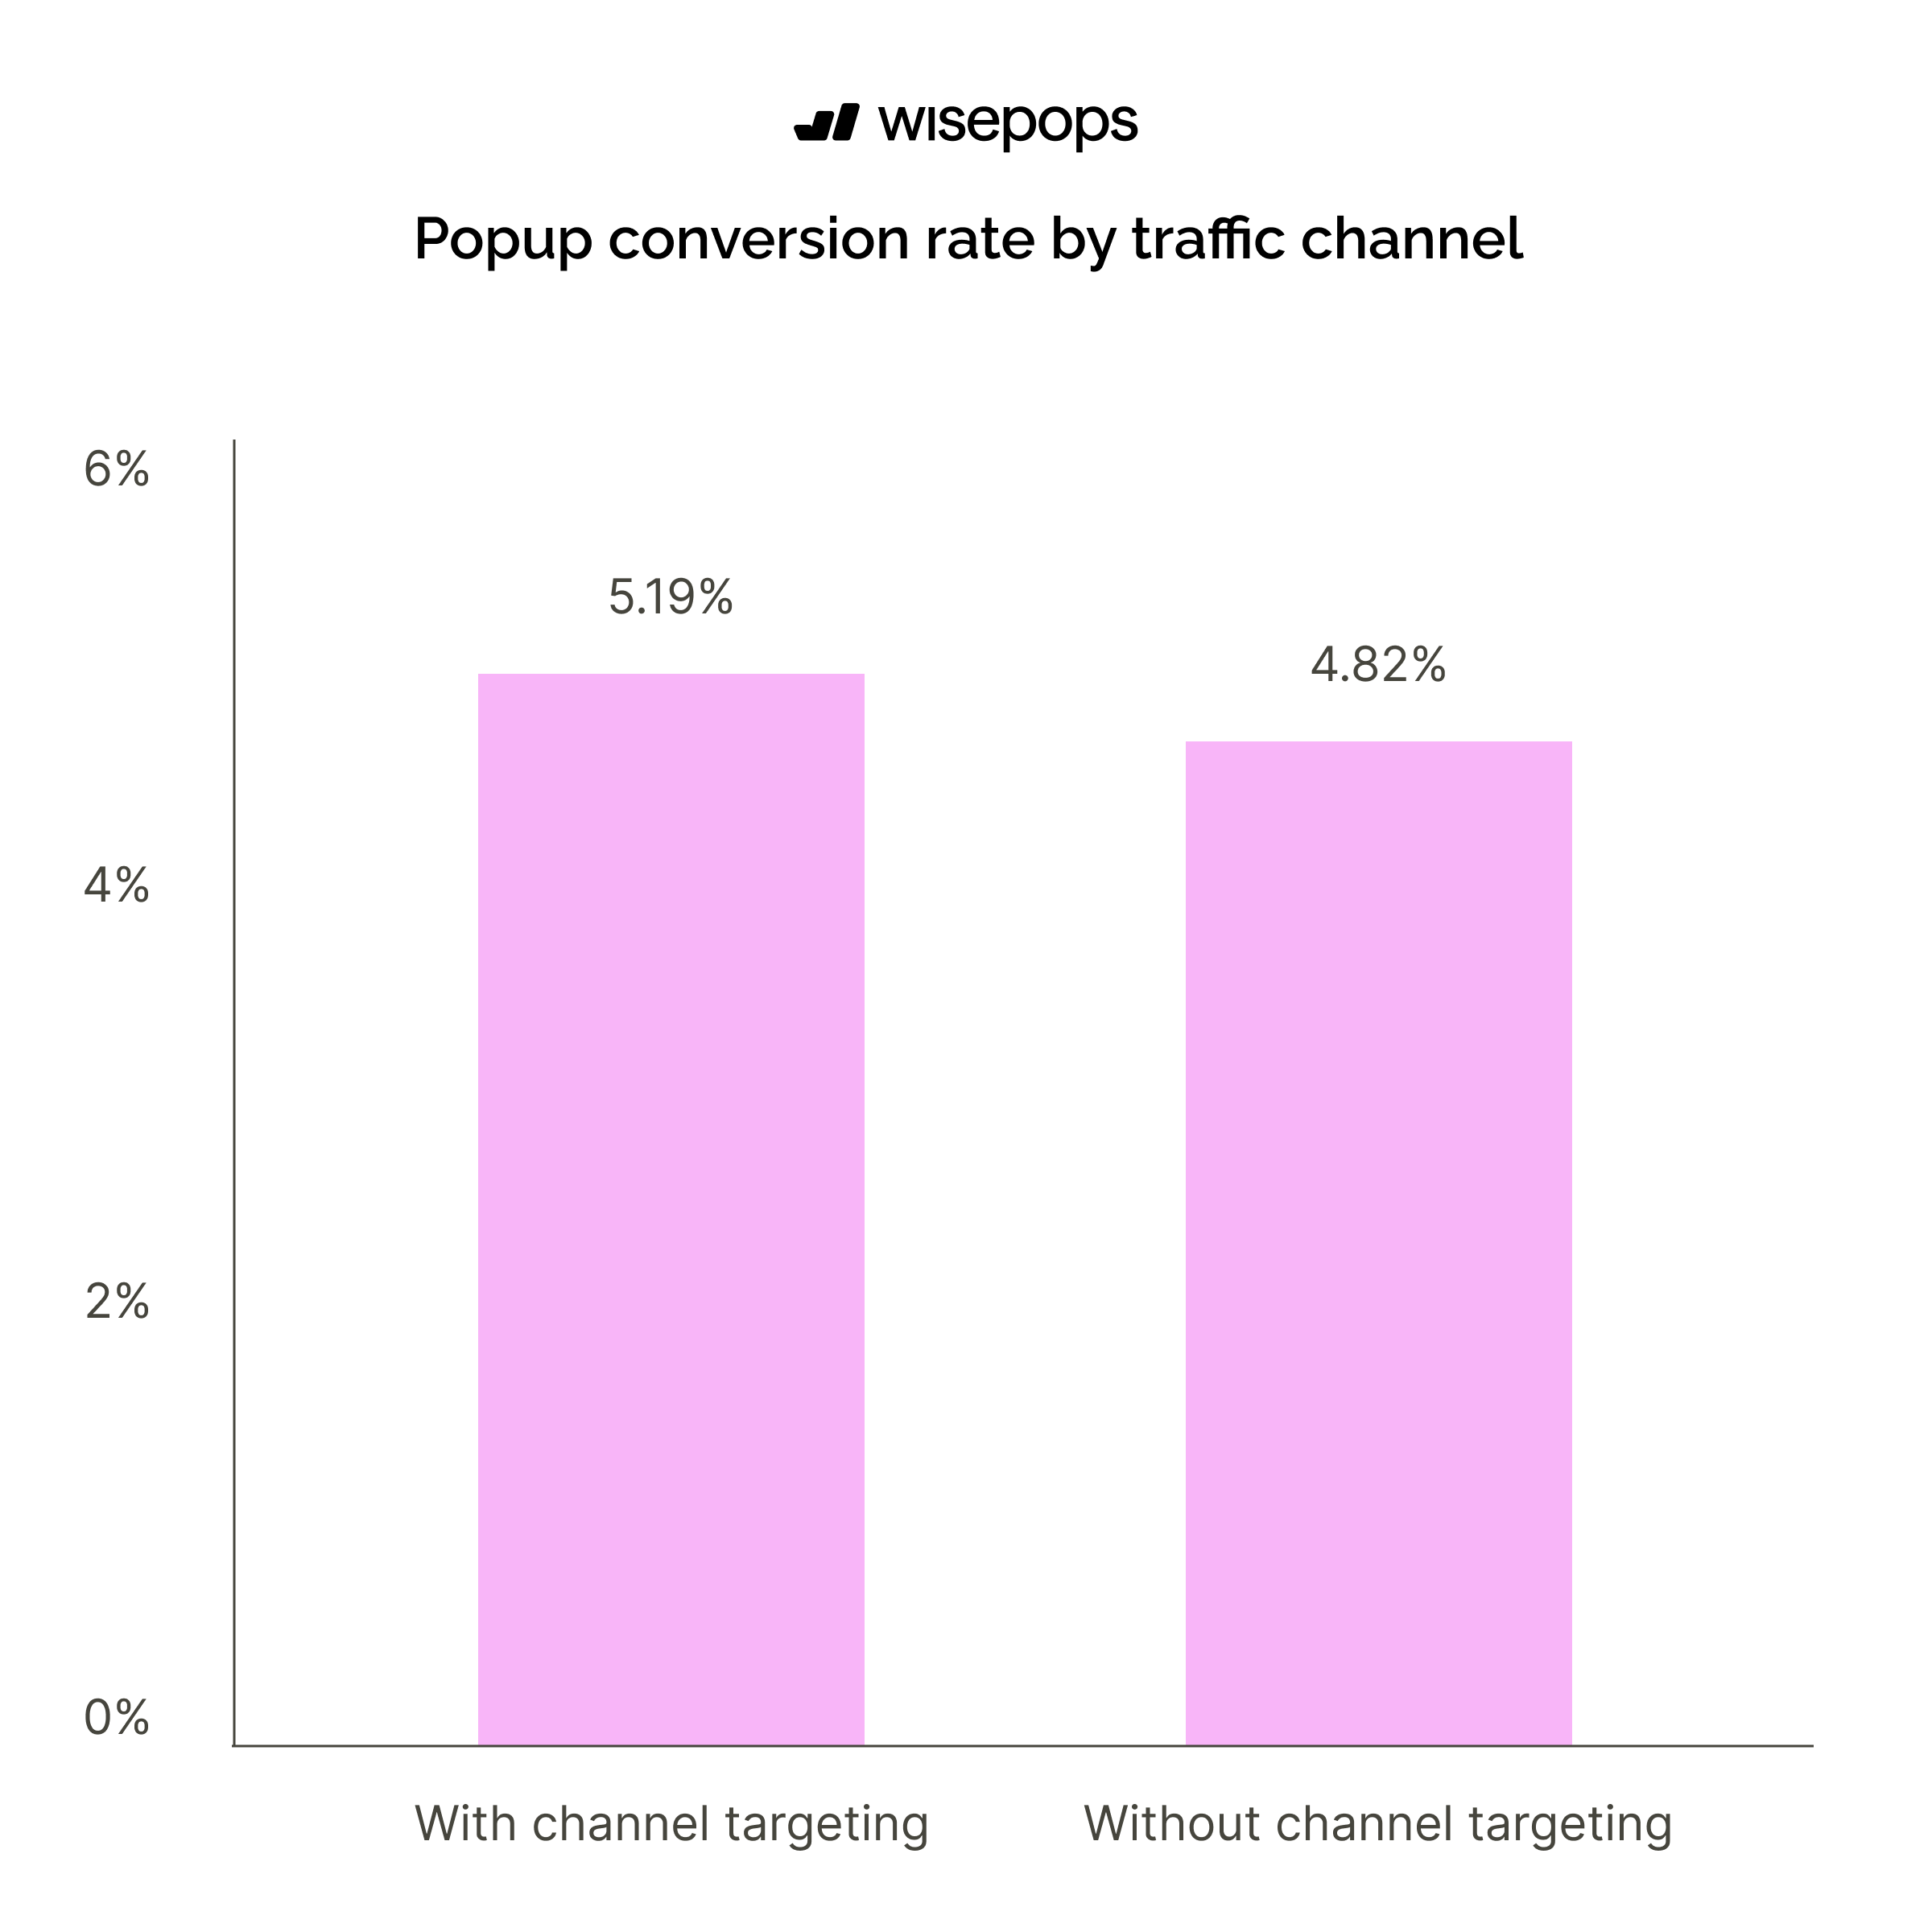
Popups with traffic channel targeting outperform non-targeted campaigns
Popups using traffic source targeting achieve a 5.19% conversion rate compared to 4.82% for popups without channel targeting.
This approach allows businesses to customize popup messaging based on whether visitors arrive from organic search, paid ads, social media, email, or direct traffic, ensuring that the offer or call-to-action aligns with the visitor's expectations and mindset from their specific acquisition channel.
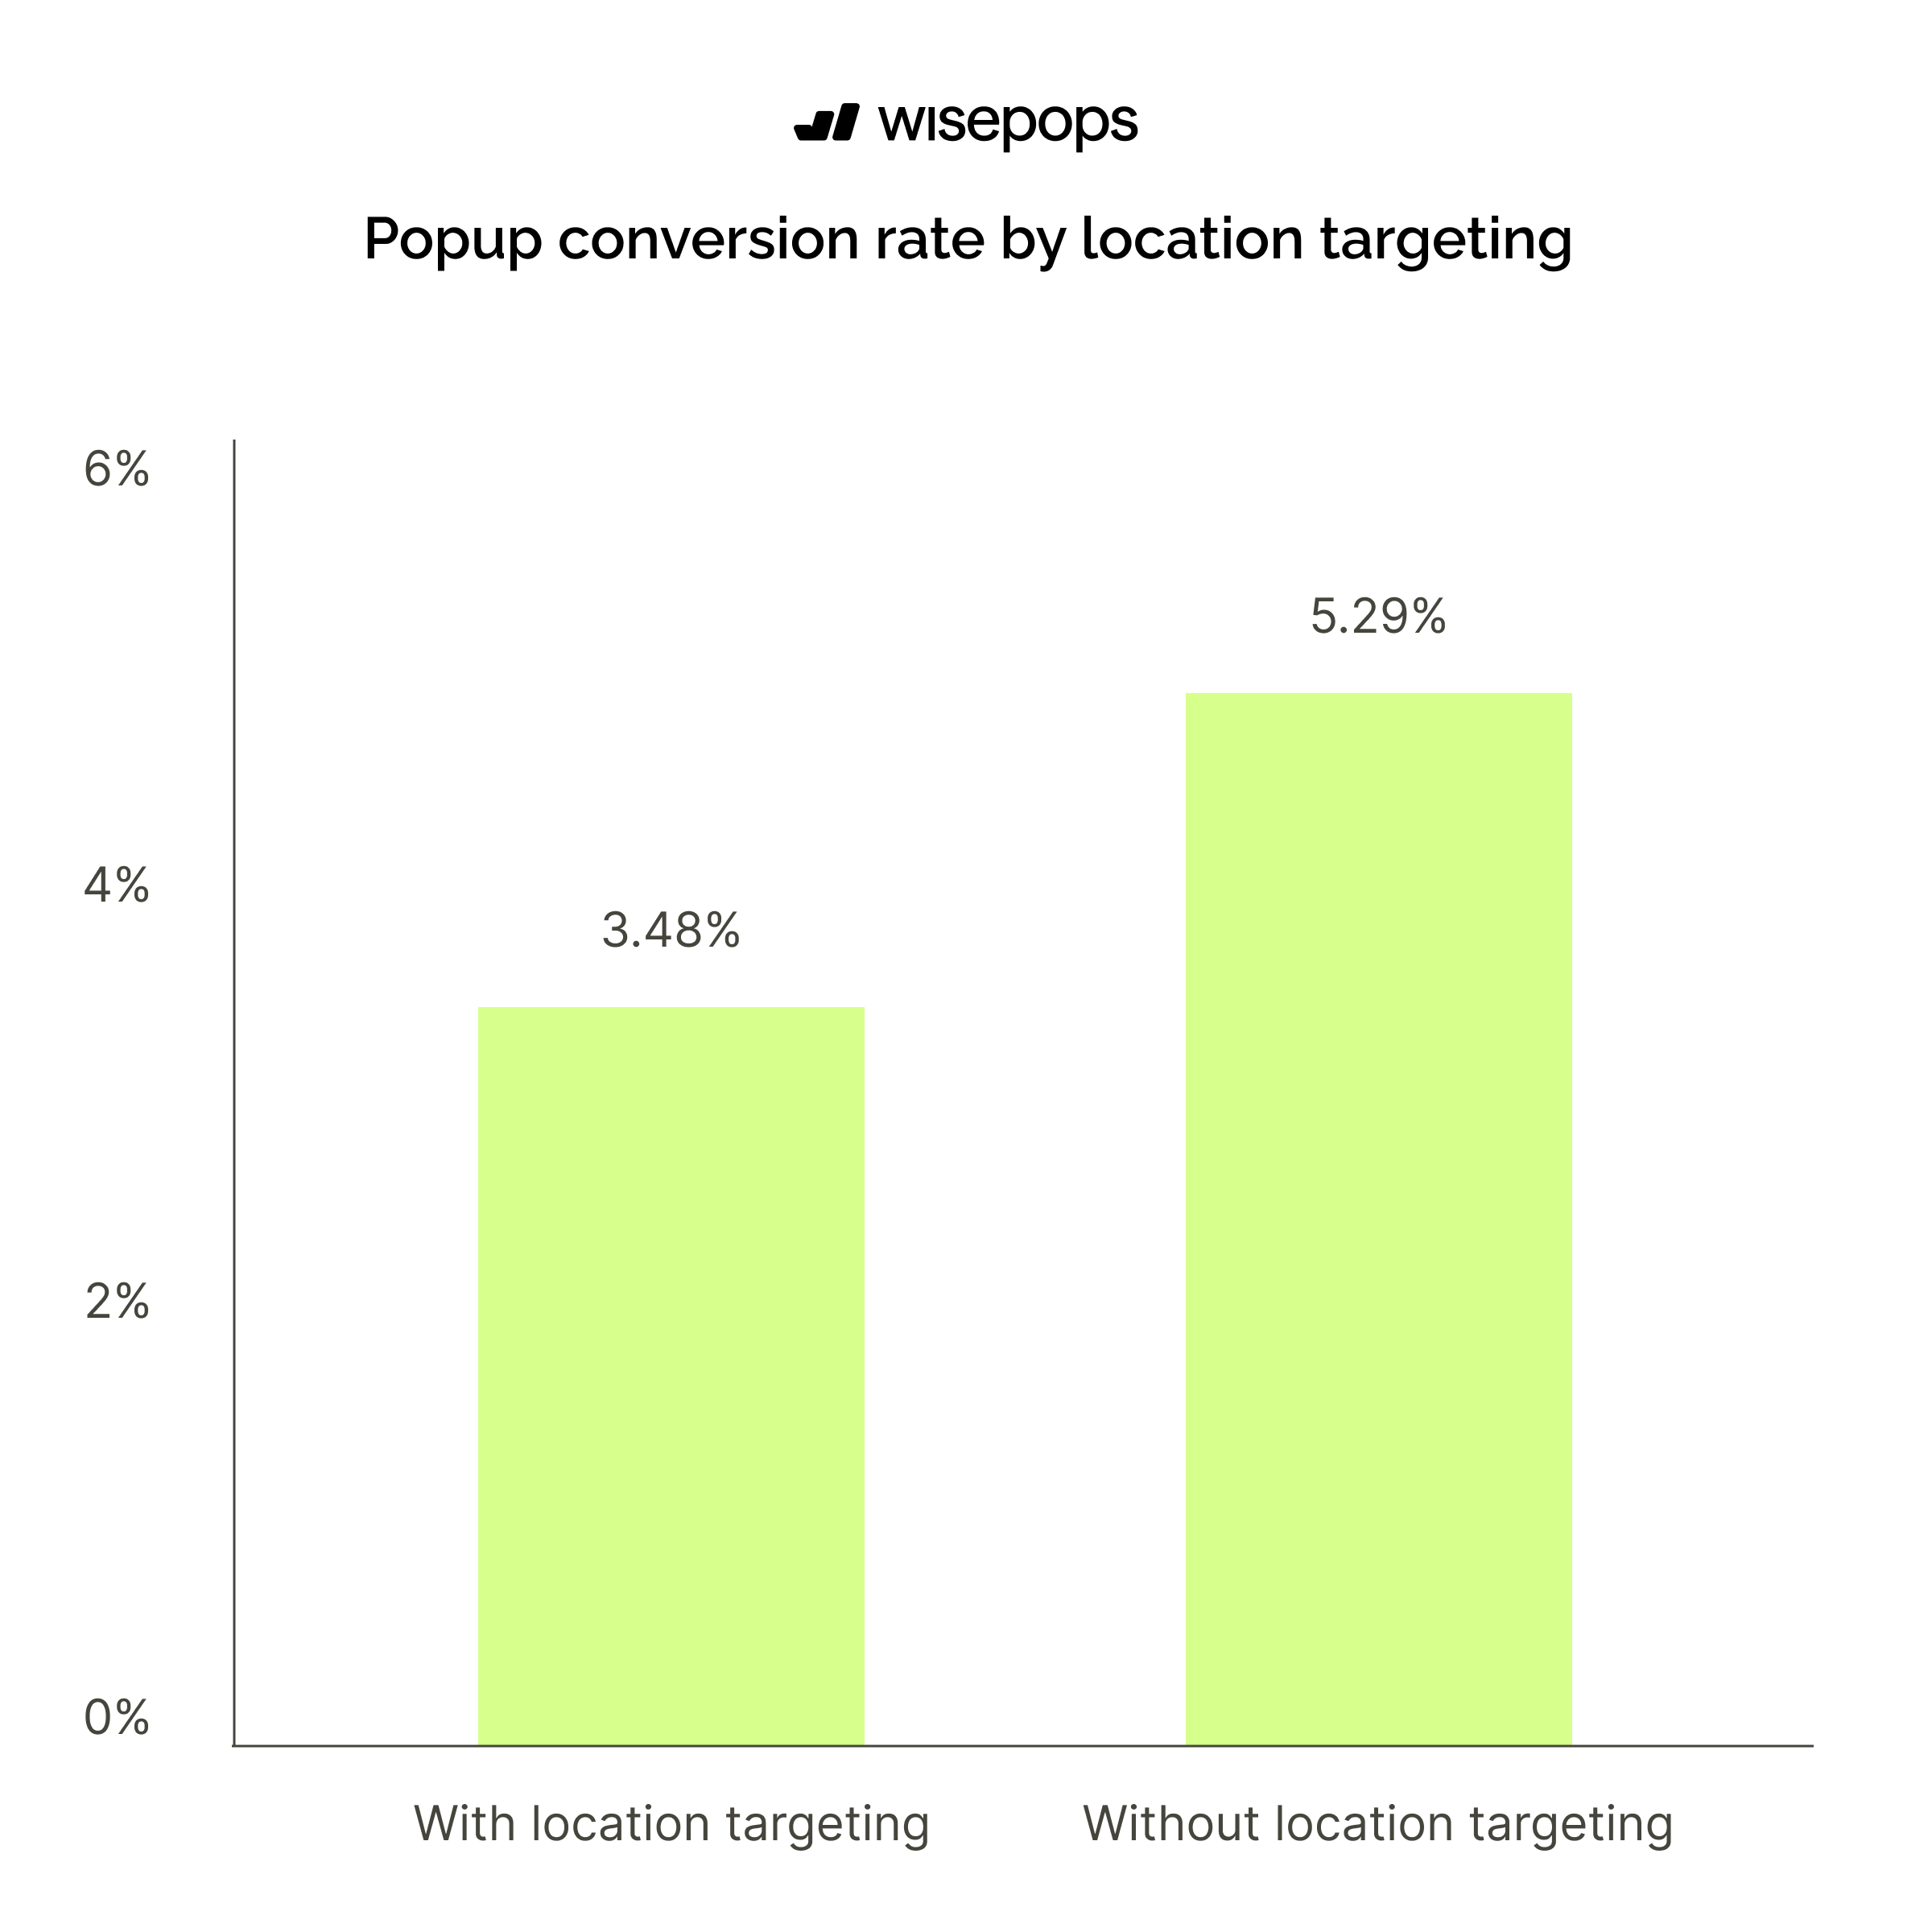
Location targeting shows mixed results in popup performance
Popups without location targeting achieve a 5.29% conversion rate, while those with location targeting convert at 3.48%.
This counterintuitive result suggests that broad campaigns may reach larger audiences more effectively. However, location targeting remains valuable for businesses with region-specific offers, shipping restrictions, compliance requirements, or localized promotions
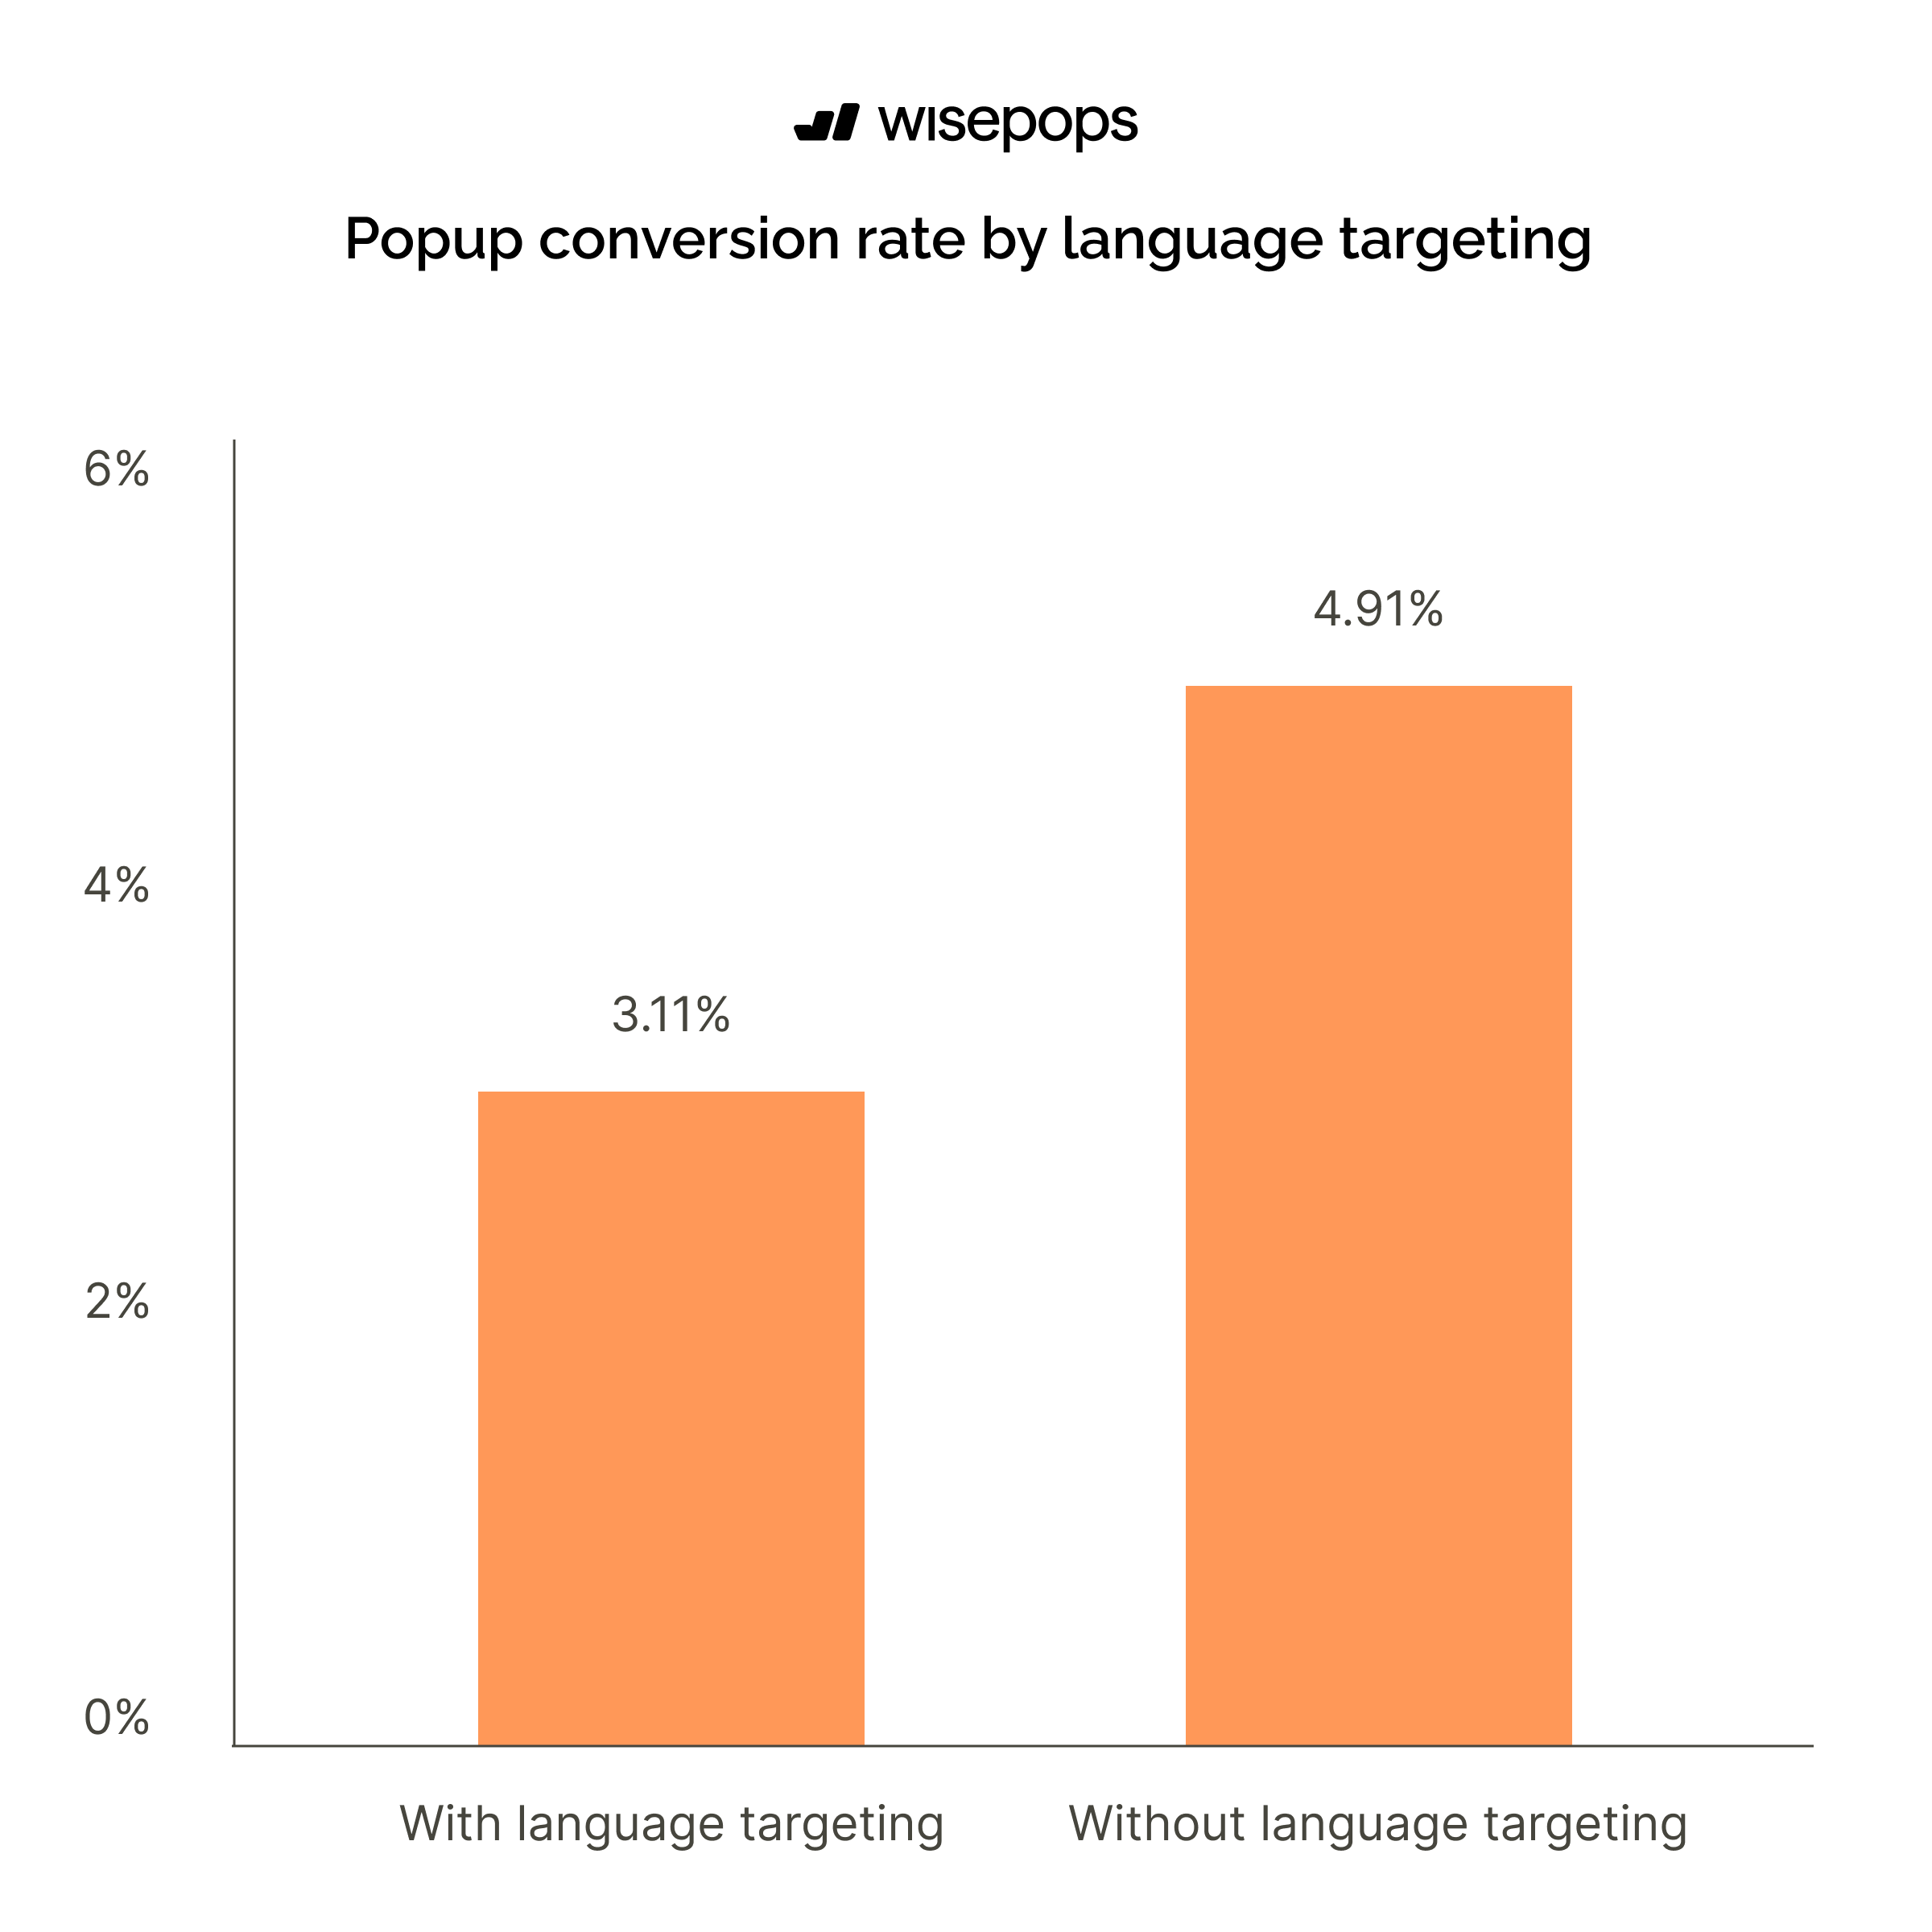
Language targeting shows lower conversion rates than non-targeted popups
Popups without language targeting achieve a 4.91% conversion rate, while those with language targeting convert at 3.11%.
This suggests that language-specific campaigns may fragment audiences or that automatic browser language detection isn't always accurate, potentially showing the wrong language to visitors.
However, language targeting remains essential for truly multilingual websites serving diverse global markets, where displaying popups in a visitor's native language improves comprehension, trust, and user experience.
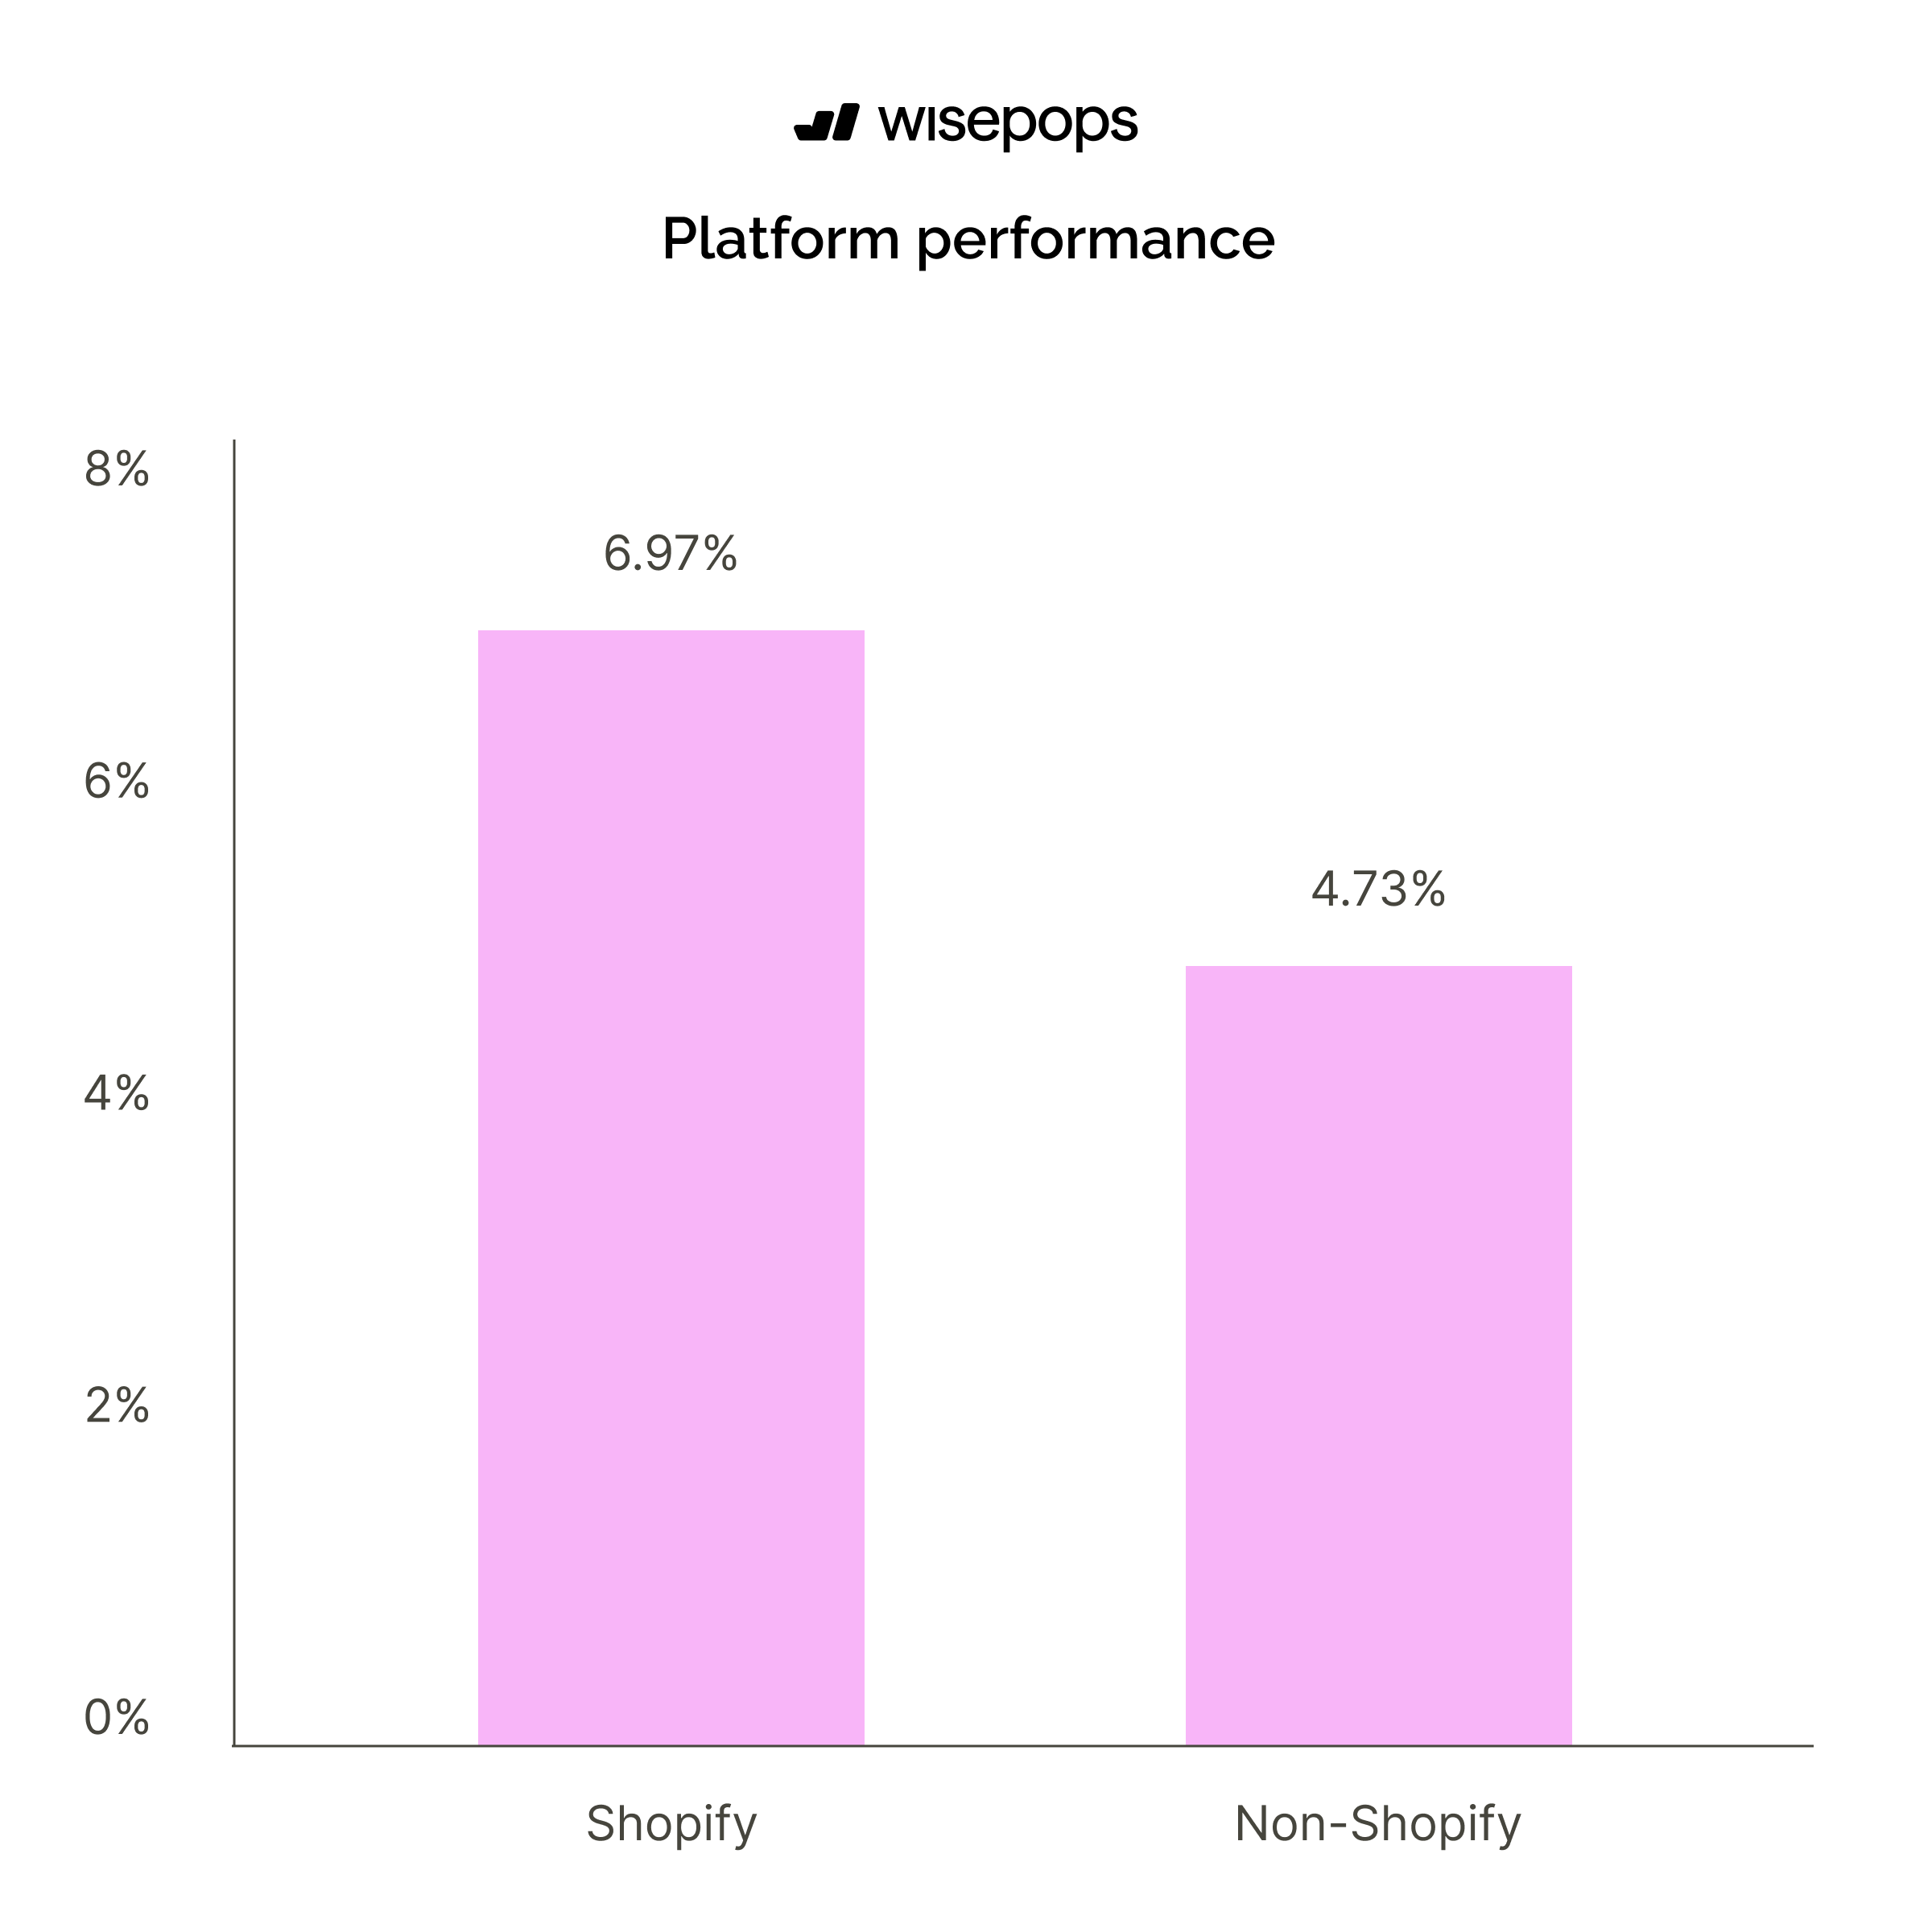
Do popups perform differently on Shopify vs other platforms?
Popups on Shopify stores achieve a 6.97% conversion rate, outperforming popups on non-Shopify platforms at 4.73%.
This 47% performance advantage suggests that Shopify's ecosystem creates a more conducive environment for popup conversions, or that Shopify merchants may be implementing more sophisticated popup strategies for revenue.
Top 10% campaigns' CVR:
The top 10% of campaigns deliver a 56.27% conversion rate.
Popup statistics: summary
Based on analysis, essential tactics like offering discounts, adding countdown timers, and including images remain essential.
But here are the more advanced strategies that separate top performers:
Optimize for mobile-first experiences. Mobile users convert at significantly higher rates than desktop visitors. Design your popups specifically for mobile screens rather than simply adapting desktop versions.
Implement multi-step formats. Breaking your popup into multiple steps makes the process feel less overwhelming and more rewarding to complete. This progressive approach consistently outperforms traditional single-step forms.
Target based on visitor journey stage. New visitors respond exceptionally well to welcome offers, while returning visitors need different messaging. Segment your campaigns based on where people are in their relationship with your brand.
Use AI triggers for ecommerce. AI triggers are a newer innovation that's proving highly effective for online stores by predicting the best moment to engage each visitor based on their behavior patterns.
Apply UTM and traffic source targeting. Customize popup messaging based on where visitors came from—whether organic search, paid ads, social media, or email. Aligning your message with their arrival context significantly improves relevance.
Perfect your timing with delayed displays. Show popups after visitors have viewed a page or two and spent enough time to demonstrate genuine interest, rather than immediately upon landing.
Continuously A/B test beyond the basics. Test display delays, positioning, format variations, and visitor targeting rules—not just headlines and colors. Small optimizations across multiple elements compound into major performance gains.
If you’d like to learn more about popups, let me suggest these guides from our blog:
Get started
in minutes
Start converting more visitors today.
Get started in minutes and see results right after.